Second Most Spoken Languages in the U.S. Map

Alex Cartwright
Senior Cartographer & GIS Specialist
Alex Cartwright is a renowned cartographer and geographic information systems specialist with over 15 years of experience in spatial analysis and data...
Geographic Analysis
What This Map Shows
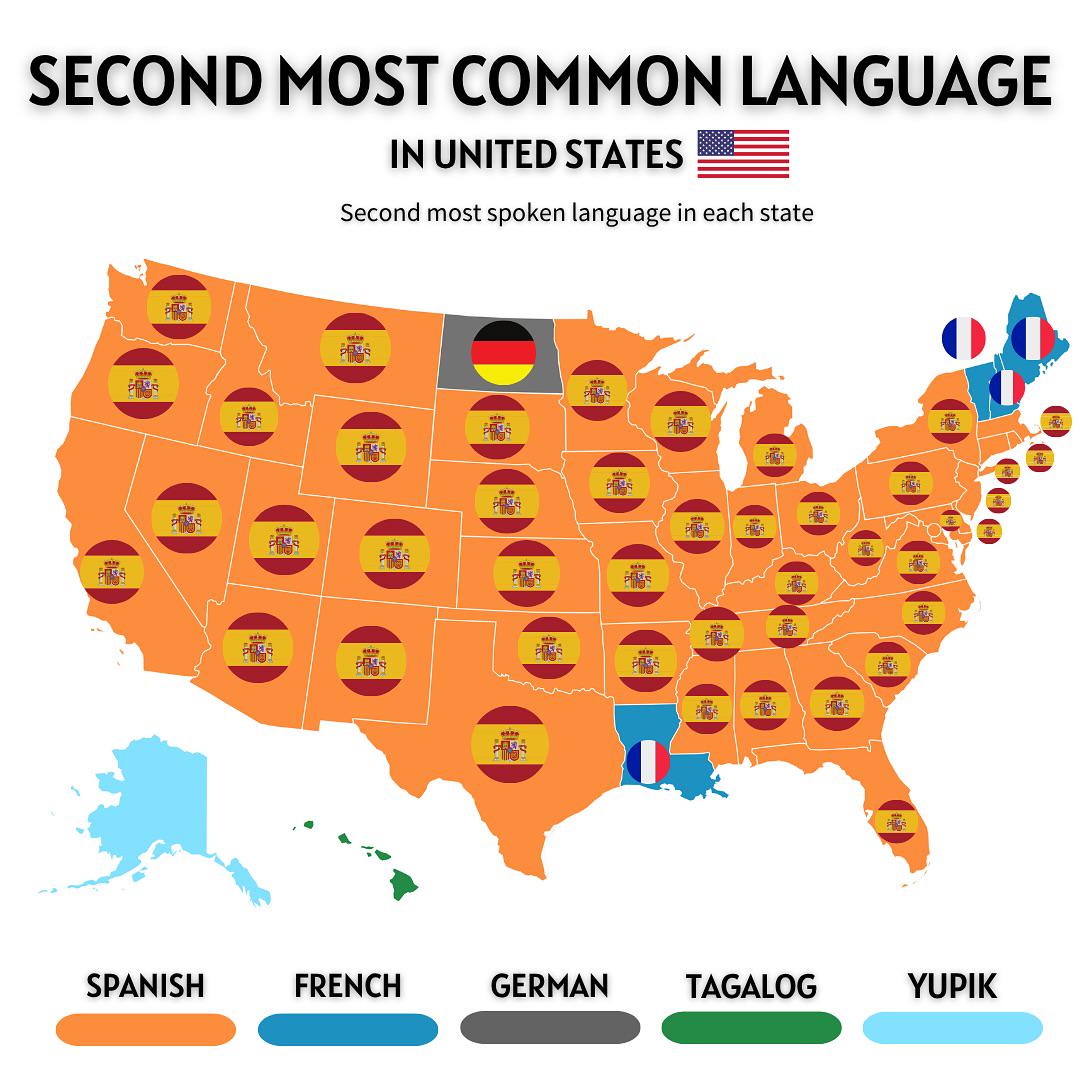
The "Second Most Spoken Languages in the U.S. Map" provides a fascinating glimpse into the linguistic diversity of the United States. This visualization highlights the languages that rank second in usage across different states, offering insight into cultural influences and migration patterns that have shaped the American landscape. As English continues to dominate as the primary language, this map reveals the rich tapestry of languages that follow, showcasing how communities across the country communicate and connect.
Deep Dive into Second Most Spoken Languages
Languages are more than mere tools of communication; they are the vessels of culture, history, and identity. The map illustrates the second most spoken languages in each state, showcasing the influence of immigration, colonization, and cultural exchange on American society. Spanish stands out as the most frequently spoken second language, prevalent in states like California, Texas, and New York, reflecting the strong Hispanic presence and the historical ties these regions have to Spanish-speaking countries.
However, it's not just Spanish that makes the list. In states like New Jersey, Italian holds a prominent position, while in Louisiana, French continues to be spoken widely, echoing the state’s rich Creole and Cajun heritage. Interestingly, in Alaska, the second most spoken language is a native one—Inupiat, representing the indigenous peoples who have lived in the region for thousands of years. This highlights the importance of preserving native languages amid globalization.
Have you ever wondered why certain languages thrive in specific states? Economic opportunities, cultural centers, and community networks all play a role. For example, in regions with a significant number of immigrants from a particular country, their native language often becomes the second most spoken language. In states with large Asian populations, such as Hawaii, Tagalog and Japanese are among the top contenders, reflecting the diverse immigrant communities that have settled there.
According to the U.S. Census Bureau, over 350 languages are spoken in the United States, showcasing the incredible diversity of the nation. In fact, nearly 21% of Americans speak a language other than English at home. This statistic emphasizes the importance of multilingualism and the need for language programs in education and public services. The map serves as a reminder that language is not static; it evolves with demographic shifts, societal changes, and cultural interactions.
Regional Analysis
When examining the map more closely, distinct patterns emerge regionally. In the Southwest, Spanish dominates, not only due to the proximity to Mexico but also due to historical migration patterns and trade relationships. Meanwhile, in the Northeast, Italian and Portuguese find their strongholds, reflecting the waves of European immigration during the late 19th and early 20th centuries. The presence of these languages in urban centers highlights how cities often act as cultural melting pots.
In the Midwest, German emerges as a significant second language, particularly in states like Wisconsin and North Dakota, where there are historic German communities. In contrast, the Pacific Northwest showcases a mix of languages, including Chinese, reflecting the region's trade links with Asia and the influx of Asian immigrants in recent decades. These linguistic patterns not only reveal the demographic makeup of the states but also offer insight into their cultural narratives and historical contexts.
Significance and Impact
Understanding the linguistic landscape of the U.S. is crucial for several reasons. Language is tied intimately to cultural identity, and by recognizing the second most spoken languages, we gain a better understanding of the diverse communities that inhabit our nation. This awareness can influence everything from education policies to community services and even business strategies. In an increasingly globalized world, companies must consider multilingual communication to effectively engage with their diverse clientele.
Moreover, as we project into the future, the trends in language usage will likely continue to shift. The rise of technology and social media is fostering new forms of communication and language development, such as Spanglish and other creole languages. Additionally, with ongoing immigration and the globalization of communities, we may see new languages emerge as second languages in various states.
In conclusion, the "Second Most Spoken Languages in the U.S. Map" is not just an illustration of linguistic data; it is a reflection of the cultural mosaic that is America. Each language tells a story, connecting us to our past while shaping our future interactions. Have you considered how your own linguistic background fits into this broader picture? The languages we speak not only define who we are but also how we relate to the world around us.
Visualization Details
- Published
- August 8, 2025
- Views
- 108
Comments
Loading comments...