Income Inequality Gini Coefficient Map

David Chen
Data Visualization Specialist
David Chen is an expert in transforming complex geographic datasets into compelling visual narratives. He combines his background in computer science ...
Geographic Analysis
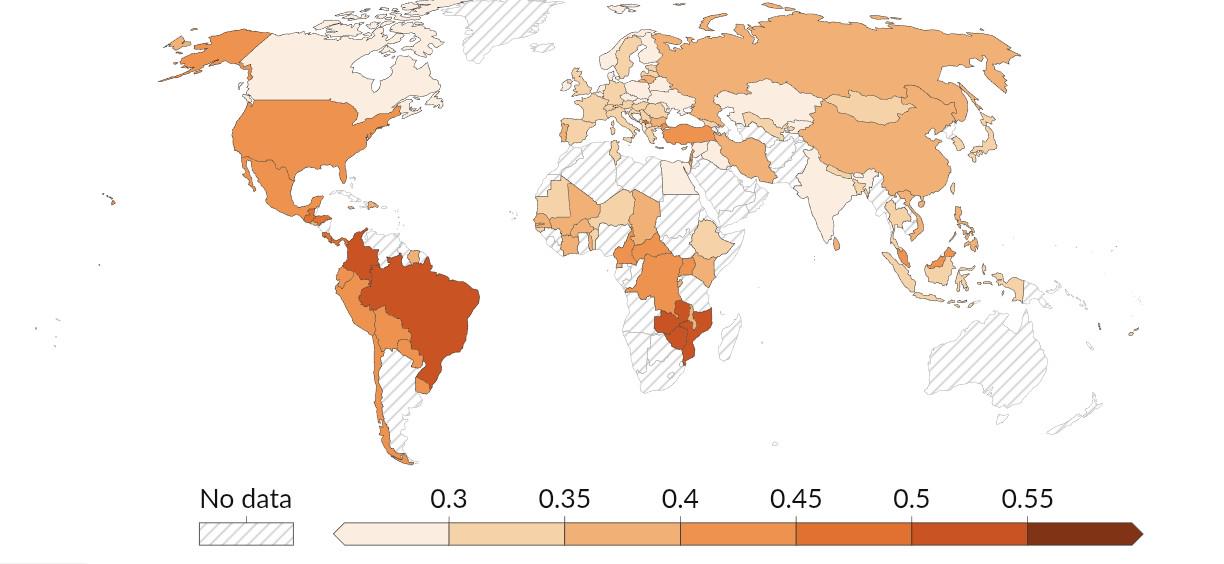
What This Map Shows
The Income Inequality Gini Coefficient Map visualizes the varying levels of income inequality across different countries, showcasing how wealth distribution differs globally. The Gini coefficient is a numerical measure ranging from 0 to 1, where 0 indicates perfect equality (everyone earns the same) and 1 signifies extreme inequality (one person holds all the wealth). This map allows us to see at a glance which nations are grappling with disparities in income and where relative equality prevails.
Deep Dive into Income Inequality
Income inequality is a pressing issue that affects social stability, economic growth, and overall quality of life. Understanding how wealth is distributed within a population is crucial for addressing poverty and fostering equitable development. The Gini coefficient, developed by the Italian statistician Corrado Gini in 1912, has become a standard measure for economists and policymakers alike.
Interestingly, the roots of income inequality can be traced to numerous factors, including historical contexts, government policies, education levels, and access to resources. For instance, countries with a strong emphasis on social welfare programs, such as the Nordic nations, tend to exhibit lower Gini coefficients, reflecting a more equitable distribution of wealth. In contrast, many developing countries struggle with high Gini values due to a combination of bureaucracy, lack of access to quality education, and economic opportunities concentrated within elite classes.
Recent reports indicate that income inequality has been rising globally, particularly in developed economies. The World Bank highlights that while some countries have made strides in reducing poverty, the gap between the rich and poor continues to widen. This disparity can lead to social unrest, as marginalized populations feel excluded from economic growth. For example, in the United States, the Gini coefficient has steadily increased over the past few decades, showcasing a troubling trend where the wealthiest 10% hold a disproportionate amount of the nation’s wealth.
What’s fascinating is the role of globalization in shaping income inequality. While globalization has created economic opportunities in various sectors, it has also contributed to job displacement and wage stagnation for lower-income workers. As countries become more interconnected, the impact of economic policies in one region can ripple through to others, complicating efforts to address inequality.
Regional Analysis
When examining the Gini coefficient map, distinct regional patterns emerge. For instance, in sub-Saharan Africa, many nations exhibit high Gini coefficients. Countries like South Africa and Namibia highlight severe income disparities stemming from historical inequalities rooted in colonialism and apartheid. In South Africa, the Gini coefficient has remained alarmingly high, illustrating the ongoing challenges of economic transformation.
Conversely, nations in Scandinavia, such as Sweden and Norway, show low Gini coefficients, attributed to progressive taxation, robust welfare systems, and inclusive labor markets. These countries prioritize equal access to education and health care, making strides toward reducing income inequality.
Interestingly, in Asia, countries like Japan and South Korea demonstrate relatively low levels of income inequality, bolstered by strong educational systems and a focus on industrialization. However, other nations in the region, such as India, exhibit stark contrasts, with a significant Gini coefficient reflecting deep-rooted caste systems and economic stratification.
In Latin America, the landscape is mixed. While countries like Brazil have made progress in reducing inequalities through social programs like Bolsa Família, they still grapple with significant Gini coefficients. The region’s historical context, marked by colonial legacies and socio-political upheaval, has led to enduring wealth disparities.
Significance and Impact
Understanding income inequality is paramount for several reasons. Firstly, addressing these disparities is essential for fostering a healthy, stable society. High levels of inequality can lead to increased crime rates, political instability, and a sense of disenfranchisement among the populace. Moreover, when wealth is concentrated in the hands of a few, overall economic growth can stagnate, as consumer spending from lower-income groups diminishes.
Current trends indicate a growing recognition of the need to tackle income inequality. Policymakers worldwide are increasingly focusing on strategies to promote inclusive growth, such as implementing minimum wage laws, expanding social safety nets, and investing in education and job training programs.
As we look to the future, it’s crucial to monitor how global events, such as technological advancements and climate change, will further impact income distribution. Will we see a continued rise in inequality, or can concerted global efforts lead to a more equitable world? The answers to these questions will shape the economic landscape for years to come, making the study of income inequality and the Gini coefficient ever more relevant.
Visualization Details
- Published
- October 10, 2025
- Views
- 36
Comments
Loading comments...