Uninsured Rates in the US Map

Marcus Rodriguez
Historical Geography Expert
Marcus Rodriguez specializes in historical cartography and geographic data analysis. With a background in both history and geography, he brings unique...
Geographic Analysis
What This Map Shows
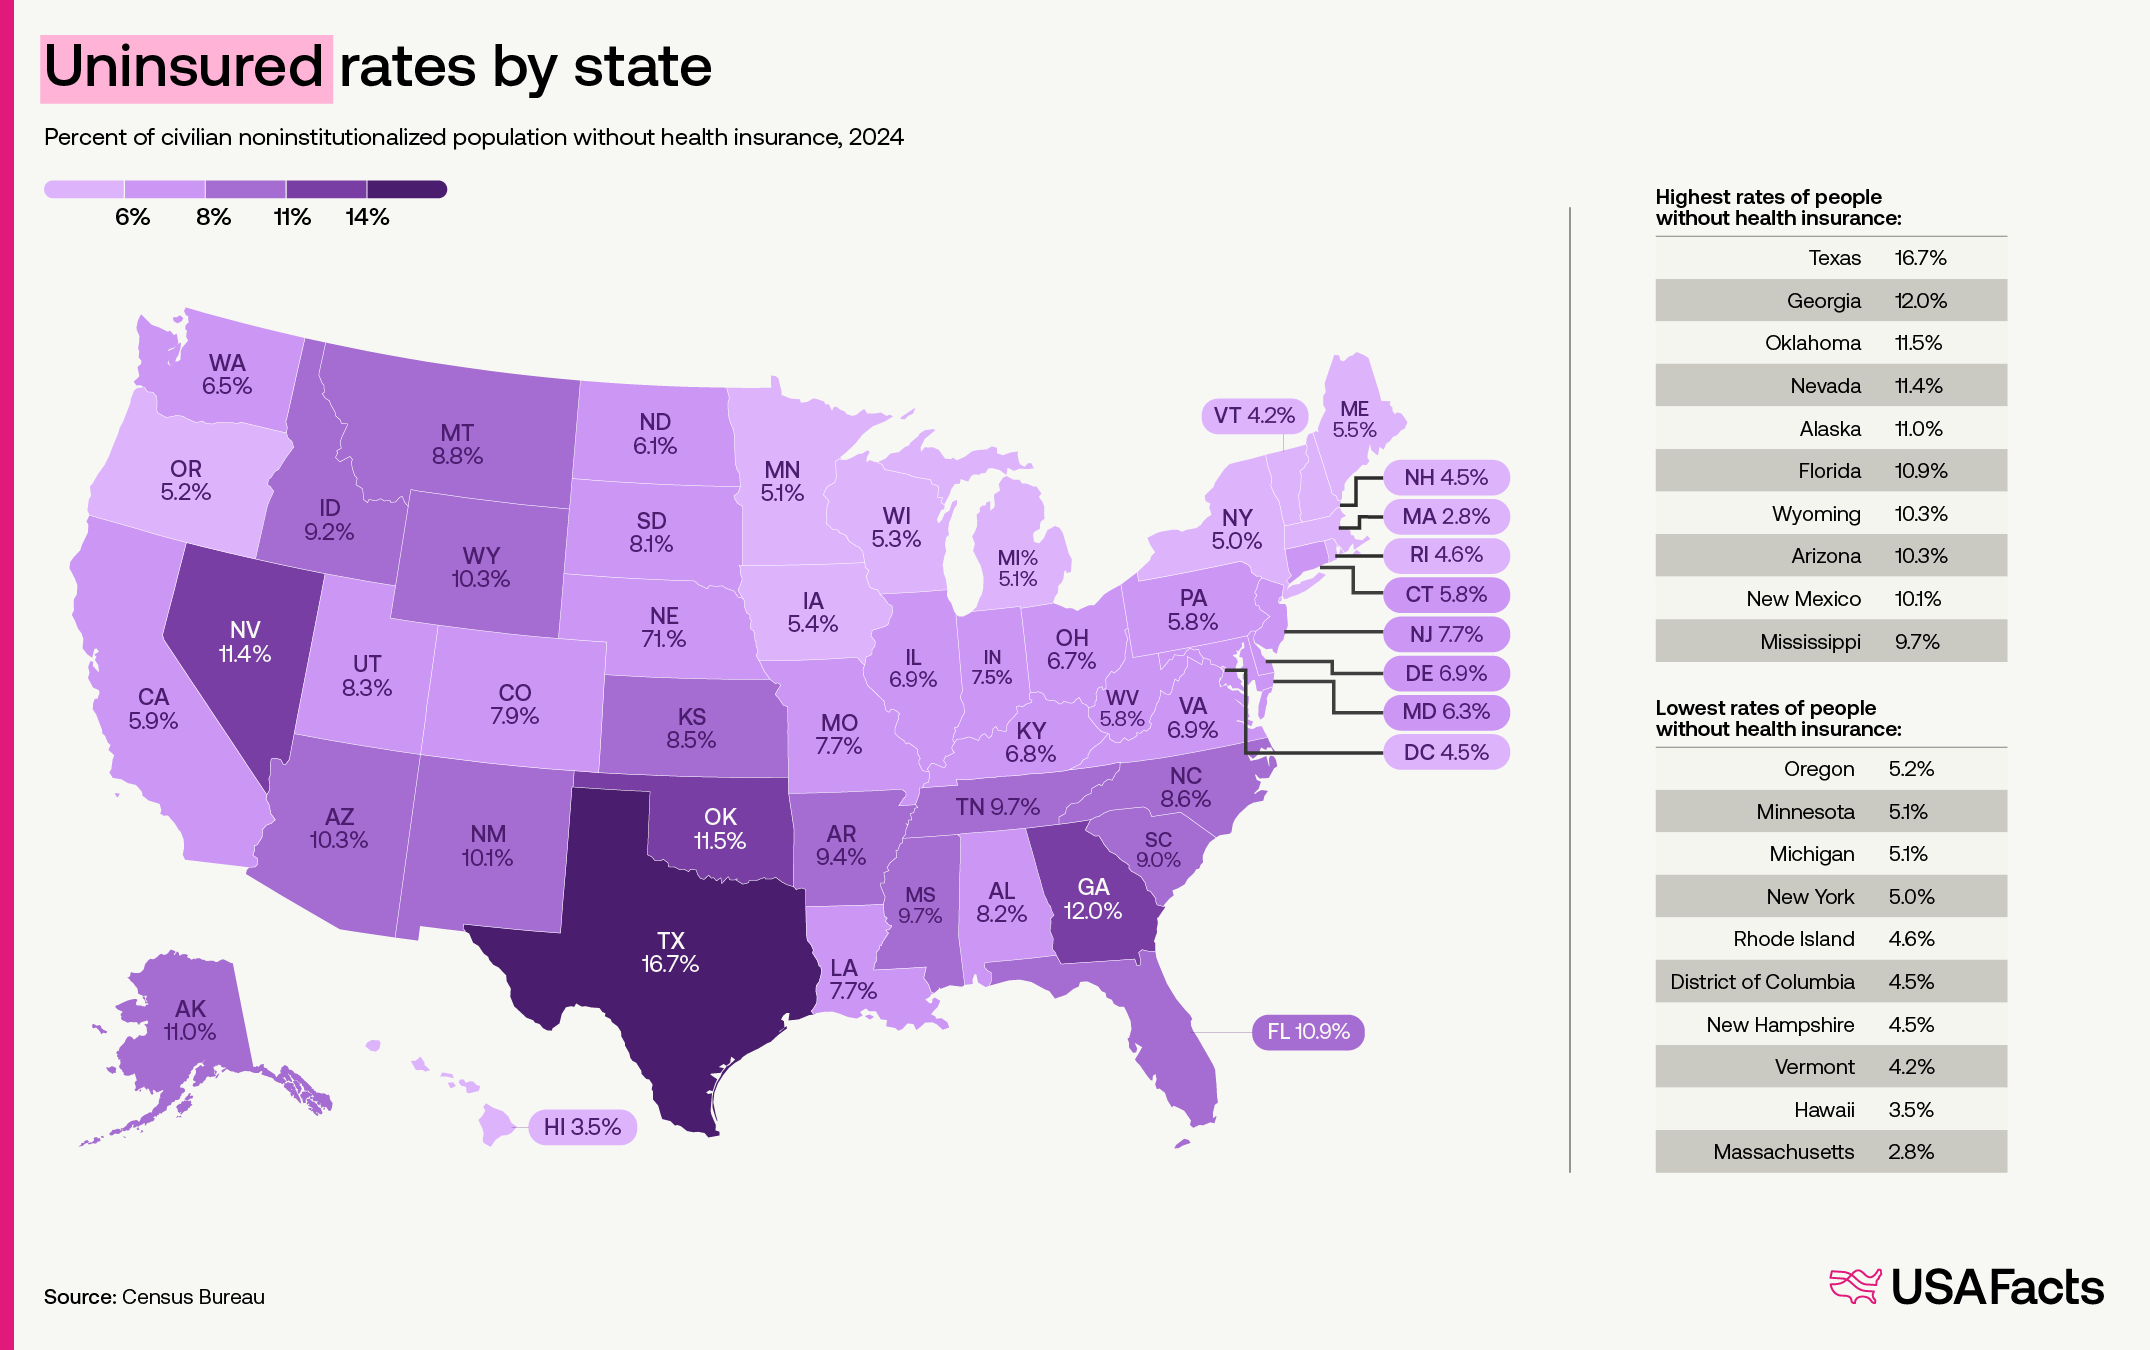
The "Uninsured Rates in the US Map" provides a visual representation of the percentage of individuals lacking health insurance across different states in the United States for the year 2024. At a glance, this map reveals stark contrasts in health coverage, showcasing areas where residents face significant challenges in accessing healthcare services. With a notable range, from just 2.8% uninsured in Massachusetts to a staggering 16.7% in Texas, this map highlights the disparities that exist within the nation's healthcare system.
Deep Dive into Uninsured Rates in the US
Understanding the uninsured rates in the US is crucial for grasping the broader context of healthcare accessibility and public health outcomes. As detailed by the US Census Bureau, by 2024, approximately 92.0% of people had health insurance, indicating a steady trend over the past decade where coverage has consistently remained above 90%. The statistics suggest that while most Americans are covered, a significant minority still lacks essential health services, which can lead to dire health consequences.
The breakdown of coverage types reveals that 66.1% of Americans were enrolled in private health insurance plans, while 35.5% relied on some form of public insurance. It’s essential to note that these figures can overlap; many individuals are covered by both private and public plans, which accounts for the percentages exceeding 100%. This blended approach to insurance coverage has implications for how health services are delivered and accessed across different populations.
Interestingly, the map indicates that the states which expanded Medicaid under the Affordable Care Act (ACA) have generally lower uninsured rates compared to those that did not. For instance, in 2024, the uninsured rate among children and working-age adults in states with expanded Medicaid was 4.6% and 9.2%, respectively. Contrast this with states that did not expand Medicaid, where those figures nearly doubled to 9.4% for children and 15.7% for working-age adults. This stark difference invites a deeper examination of how policy decisions can directly impact the health and well-being of populations.
Regional Analysis
When analyzing the map by region, it becomes clear that geographic and political factors play a significant role in health insurance coverage. For example, states like Massachusetts and Vermont, which have robust public health policies, report some of the lowest uninsured rates in the country. These states have made considerable investments in health education and accessibility, resulting in a population that is generally more informed about their healthcare options.
On the other hand, the Southern states, particularly Texas, Louisiana, and Alabama, show a higher prevalence of uninsured individuals. These states have historically resisted expanding Medicaid, leading to wider gaps in coverage. In Texas, the uninsured rate stands at 16.7%, which is concerning given the state’s large population. This raises an important question: how do these disparities affect overall health outcomes and economic stability in these regions?
Moreover, states like Florida and Georgia, which also have high uninsured rates, face unique challenges due to demographic factors and varying levels of healthcare infrastructure. In urban areas, access to healthcare services may be more readily available, yet many residents remain uninsured due to the high costs associated with private insurance plans.
Significance and Impact
The implications of uninsured rates extend beyond mere statistics; they have profound effects on public health and economic stability. High uninsured rates often correlate with poorer health outcomes, as individuals lacking insurance may delay seeking medical care until emergencies arise. This can lead to increased healthcare costs for states and communities, as untreated conditions escalate into more serious health crises.
Furthermore, the ongoing discourse around healthcare reform in the US is essential, especially in light of these disparities. With the pressure to expand Medicaid access and improve insurance coverage, understanding the regional differences in uninsured rates can inform better policy decisions aimed at closing these gaps. As we move forward, addressing these disparities will not only enhance individual health outcomes but also contribute to a healthier, more equitable society overall.
In conclusion, the "Uninsured Rates in the US Map" serves as a crucial tool for understanding the complexities of health insurance coverage across the nation. With ongoing debates about healthcare access and policy reforms, this visualization highlights an urgent need for improved coverage strategies, particularly in states with high uninsured rates. The journey towards universal health coverage may be fraught with challenges, but mapping these disparities is a vital step in addressing the healthcare crisis in America.
Visualization Details
- Published
- October 3, 2025
- Views
- 36
Comments
Loading comments...