World Stress Map of Tectonic Activity 2025

David Chen
Data Visualization Specialist
David Chen is an expert in transforming complex geographic datasets into compelling visual narratives. He combines his background in computer science ...
Geographic Analysis
What This Map Shows
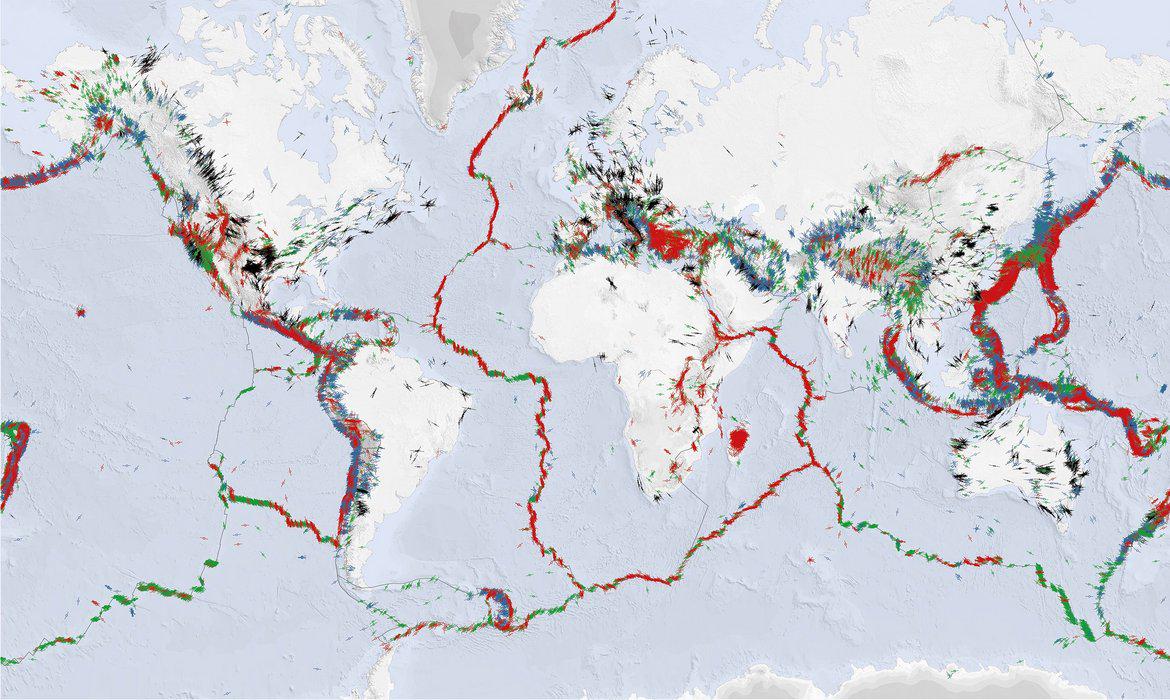
The World Stress Map 2025 provides a comprehensive view of tectonic stresses across the globe. This visualization highlights the orientation of maximum horizontal stress (SHmax) through lines that crisscross the world, while colors indicate distinct stress regimes: red for normal faulting, green for strike-slip, and blue for thrust faulting. Understanding these stress regimes is crucial in comprehending how tectonic forces shape our planet’s surface and contribute to geological phenomena such as earthquakes and volcanic activity.
Deep Dive into Tectonic Stress and Faulting
Tectonic stress is a fundamental concept in geology that refers to the forces acting on the Earth's crust. These stresses arise primarily from the movement of tectonic plates, which float on the semi-fluid asthenosphere beneath them. The interactions of these plates create different stress regimes, which can lead to faulting, earthquakes, and other geological events.
The three classic stress regimes depicted on the map are: 1. **Normal Faulting Stress Regime (Red)**: In this regime, the vertical stress (SV) exceeds the maximum horizontal stress (SHmax), which in turn is greater than the minimum horizontal stress (Shmin). This scenario typically occurs in regions experiencing extensional tectonics, such as mid-ocean ridges and continental rift zones. Notably, the East African Rift is a prime example, where the crust is being pulled apart, resulting in volcanic activity and frequent earthquakes.
2. **Strike-Slip Stress Regime (Green)**: Here, the maximum horizontal stress (SHmax) is greater than the vertical stress (SV), which exceeds the minimum horizontal stress (Shmin). This type of tectonic stress is characteristic of transform boundaries, where plates slide past one another horizontally. The San Andreas Fault in California is a well-known example, where the complex interactions between the Pacific and North American plates lead to significant seismic activity.
3. **Thrust Faulting Stress Regime (Blue)**: In this regime, SHmax is greater than Shmin, which in turn exceeds SV. Thrust faulting typically occurs in compressional environments, such as convergent plate boundaries where one tectonic plate is forced over another. The Himalayas, formed by the collision of the Indian and Eurasian plates, exemplify this stress regime, resulting in some of the highest elevations on Earth and frequent seismic events.
Understanding these regimes is more than just academic; it has real-world implications for hazard assessment and mitigation policies in earthquake-prone regions. The World Stress Map serves as a valuable tool for researchers, engineers, and disaster management professionals to identify areas at risk of seismic activity and to develop strategies to minimize potential damage.
Regional Analysis
Examining the map in detail reveals striking regional variations in tectonic stress and faulting behavior. In North America, the western region is predominantly characterized by strike-slip faulting due to the San Andreas Fault system, while the eastern part experiences a more stable regime with fewer significant tectonic stresses.
Conversely, in Asia, the Himalayan region exhibits a clear thrust faulting stress regime, reflecting the immense geological forces at play due to the collision of the Indian and Eurasian plates. This has led to the formation of the Himalayan mountain range, one of the most dramatic geological features on Earth.
In contrast, regions like the East African Rift are colored red, indicating normal faulting. This divergence in stress regimes across continents illustrates how varying geological processes contribute to the planet's diverse landscapes and seismic activity.
Significance and Impact
The significance of understanding tectonic stress cannot be overstated. Earthquakes and volcanic eruptions, driven by the movements of tectonic plates, pose serious risks to populations around the world. For instance, regions with a predominance of strike-slip faulting, like California, must remain vigilant about preparedness and infrastructure resilience.
Interestingly, as global climate patterns shift and human activities alter the landscape, the interactions between natural stress regimes and anthropogenic factors may evolve. For instance, increased water extraction in arid regions could lead to subsidence and additional stresses on fault lines, potentially increasing the frequency of seismic events.
Moreover, advancements in technology and data collection methods are enabling scientists to refine their understanding of tectonic stresses, leading to improved predictive models for seismic activity. As we look towards the future, the importance of the World Stress Map will only grow, serving as a crucial resource for monitoring tectonic activity and enhancing our understanding of Earth’s dynamic systems. Are we prepared for the next big quake? Only time will tell, but with tools like the World Stress Map, we can better equip ourselves for the challenges ahead.
Visualization Details
- Published
- September 22, 2025
- Views
- 166
Comments
Loading comments...