Black Population Distribution Map of US Counties 1900 and 2020

Marcus Rodriguez
Historical Geography Expert
Marcus Rodriguez specializes in historical cartography and geographic data analysis. With a background in both history and geography, he brings unique...
Geographic Analysis
What This Map Shows
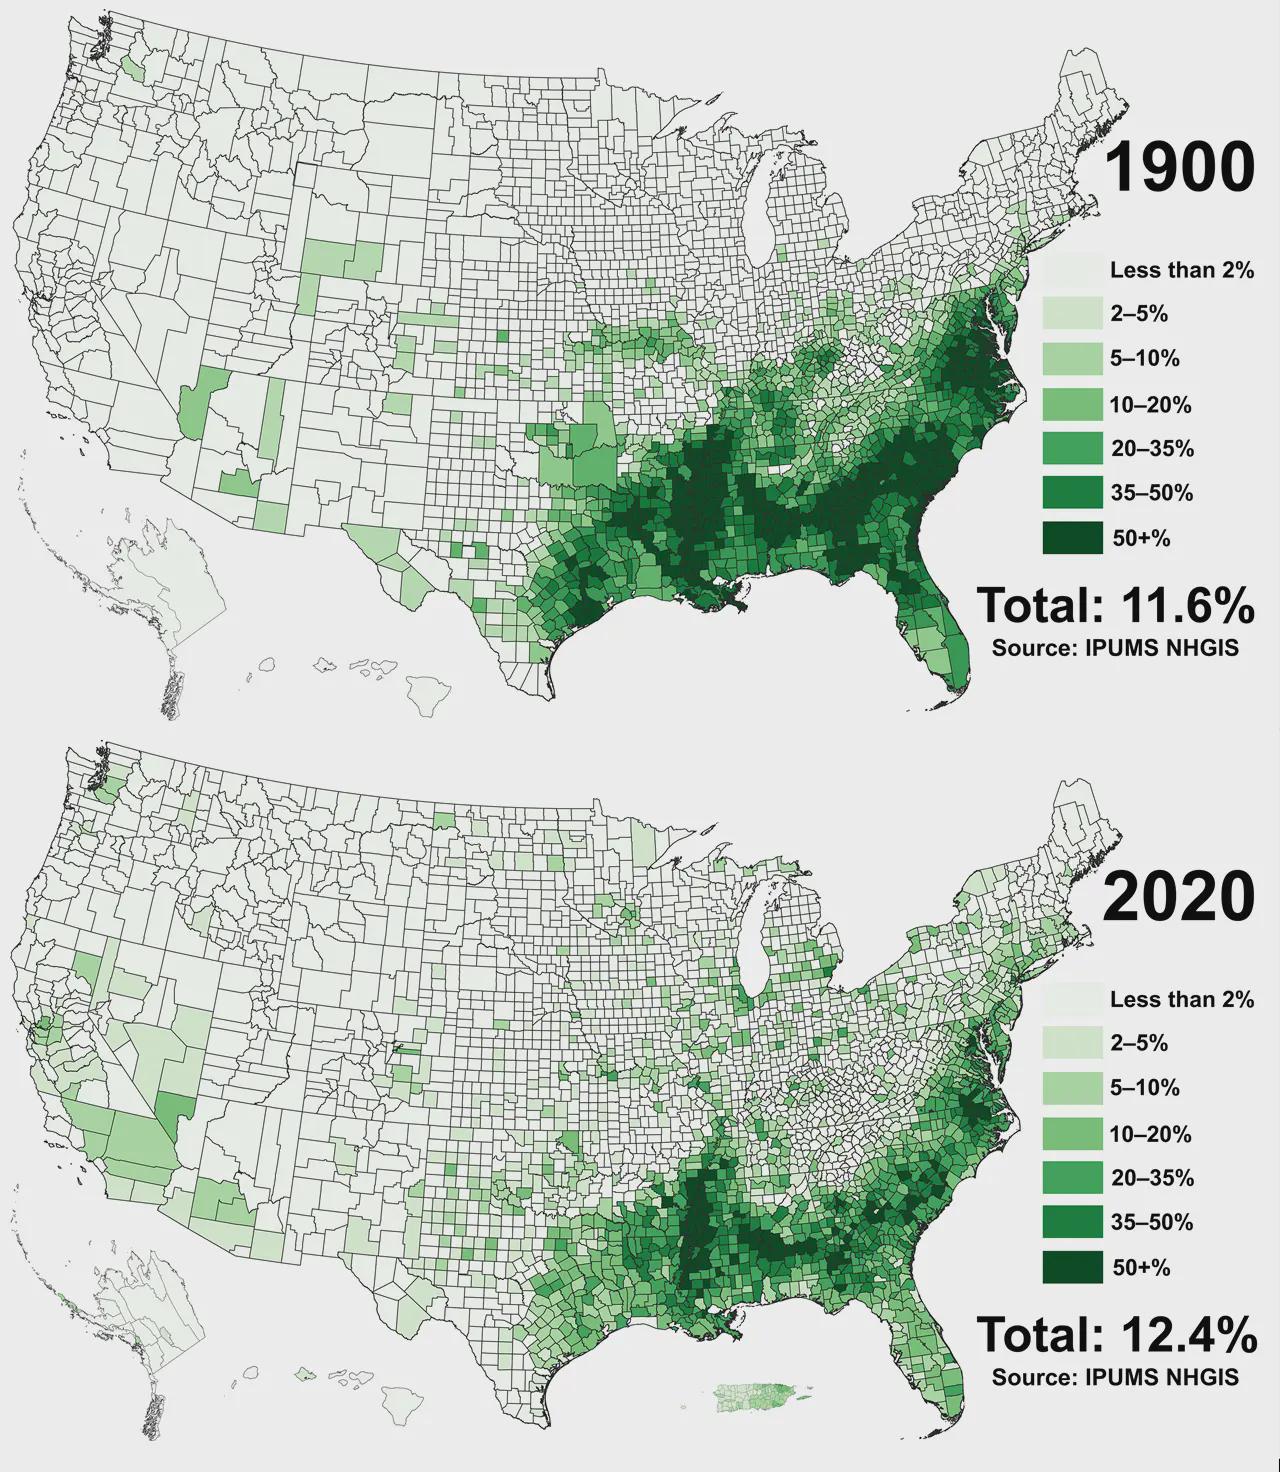
The map titled "Black Population of US Counties in 1900 and 2020" provides a striking visual representation of the demographic changes in the Black population across various counties in the United States over a span of 120 years. It highlights shifts in population density, migration patterns, and urbanization, allowing us to grasp the profound changes that have occurred in these communities. This visualization is not just a historical snapshot; it reflects the social, economic, and political transformations that have shaped the lives of Black Americans over more than a century.
Deep Dive into Black Population Trends
The trends in the Black population in the U.S. are a reflection of broader historical narratives that include slavery, the Great Migration, civil rights movements, and ongoing social dynamics. In 1900, the majority of the Black population was concentrated in the Southern states, a direct consequence of the historical context of enslavement and the Jim Crow laws that enforced racial segregation and disenfranchisement. States like Mississippi, Louisiana, and Alabama had some of the highest percentages of Black residents at that time, with rural communities dominating the demographic landscape.
However, the turn of the 20th century marked the beginning of significant changes. The Great Migration, occurring from the 1910s to the 1970s, saw millions of Black Americans move from the rural South to urban centers in the North and West in search of better economic opportunities and to escape racial oppression. By 2020, this migration had transformed the demographic map of the United States, with cities like Chicago, Detroit, and New York seeing significant increases in their Black populations. Interestingly, the map reveals that some counties in the North, such as Cook County (Chicago) and Wayne County (Detroit), have become major hubs for Black communities, illustrating the shift from rural to urban living.
As we analyze the data, it’s crucial to consider the implications of these demographic shifts. The urbanization of Black populations has led to the emergence of vibrant cultural enclaves, but it has also brought challenges such as gentrification and socio-economic disparities. The map not only serves as a depiction of where Black populations reside but also raises questions about access to resources, education, healthcare, and political representation.
Regional Analysis
When we break down the map regionally, several trends emerge. In the Northeast, cities like Philadelphia and New York have seen substantial increases in their Black populations since 1900, thanks in part to migration patterns that continued into the late 20th century. New York, for example, became a melting pot of cultures, with neighborhoods like Harlem becoming iconic centers of Black culture and history.
In contrast, Southern states, while still home to a significant portion of the Black population, show varied trends. Some counties have seen a decrease in population due to economic shifts and outmigration to urban areas. For instance, rural counties in Mississippi have experienced population declines as younger generations leave in search of better job prospects elsewhere. On the other hand, counties with major urban centers, such as Atlanta in Georgia, have witnessed growth in their Black populations, reflecting both migration and natural population increases.
Interestingly, the West shows a different pattern altogether. States like California and Texas have emerged as new destinations for Black migrants. The influx of Black residents into cities like Los Angeles and Houston over the last few decades has diversified the demographic landscape, contributing to a rich tapestry of cultural influences and community dynamics.
Significance and Impact
Understanding the distribution of the Black population in U.S. counties over time is crucial for several reasons. It sheds light on historical injustices and the ongoing struggles for equality and social justice. The patterns we see today can be traced back to systemic issues such as redlining, discriminatory housing practices, and unequal access to education and employment opportunities.
Moreover, as we look to the future, these demographic trends will continue to play a critical role in shaping policies related to urban planning, public health, and education. The growing diversity of Black populations in various regions poses both opportunities and challenges for community development and cohesion. How will cities adapt to the changing demographics? What policies will be put in place to address the unique needs of these communities?
In summary, the map isn't merely a collection of data points; it represents the lives, histories, and ongoing journeys of Black Americans. By examining these shifts, we can better understand not only the past but also the implications for the future as society continues to evolve.
Visualization Details
- Published
- September 7, 2025
- Views
- 58
- Tags
Comments
Loading comments...