Logarithmic Map of the Observable Universe

David Chen
Data Visualization Specialist
David Chen is an expert in transforming complex geographic datasets into compelling visual narratives. He combines his background in computer science ...
Geographic Analysis
What This Map Shows
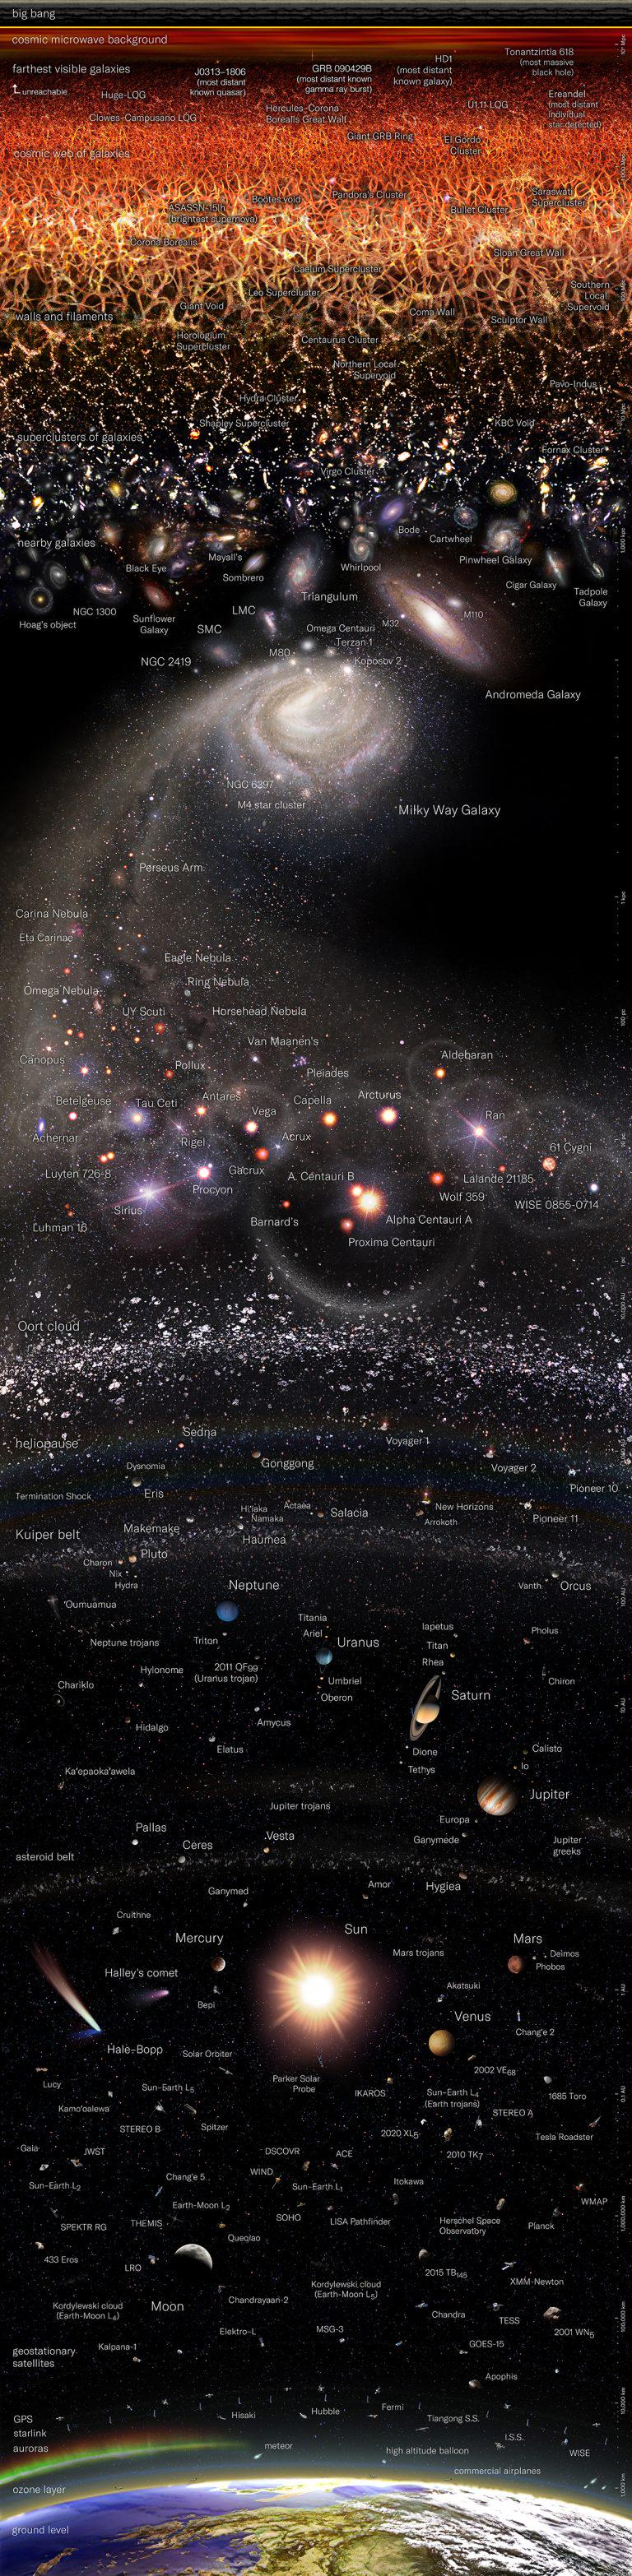
The "Logarithmic Map of the Entire Observable Universe" is a striking visualization that represents the vast expanse of our universe in a logarithmic scale. This means that distances are compressed in a way that allows us to grasp the enormity of cosmic structures, from the smallest galaxies to the largest clusters. The visualization cleverly illustrates how the universe’s structure is hierarchically organized, revealing the complex web of galaxies, groups, and superclusters that make up the cosmos.
What's fascinating is that this map not only depicts distances but also provides insights into the distribution of matter in the universe, allowing us to appreciate the scale of cosmic phenomena.
Deep Dive into the Observable Universe
The observable universe encompasses everything that we can see or detect from Earth, extending about 93 billion light-years in diameter. It is home to an estimated 2 trillion galaxies, an astonishing figure that challenges our understanding of space and time. Each of these galaxies contains billions of stars, along with gas, dust, and dark matter, which forms the backbone of cosmic structure. The logarithmic representation of this data helps to visualize relationships and distributions that would otherwise be incomprehensible at a linear scale.
Interestingly, the universe is not uniformly distributed. Galaxies tend to cluster together, forming groups and superclusters, separated by vast voids. For instance, the Milky Way is part of the Local Group, which itself is part of the larger Virgo Supercluster. This clustering effect raises intriguing questions about the gravitational forces at play and the history of cosmic evolution.
The cosmic web, a term used to describe the large-scale structure of the universe, consists of filaments of galaxies and dark matter that interconnect in a web-like fashion. This structure is shaped by the gravitational pull of dark matter, which makes up a significant portion of the universe’s mass yet remains largely invisible. The logarithmic map effectively illustrates these filaments and voids, giving us a glimpse into how matter is organized on the grandest scales.
Regional Analysis
When we break down the observable universe as depicted on the map, we can see significant variations in galaxy distribution across different regions. For example, the Virgo Supercluster, which contains the Milky Way, is densely populated with galaxies, while surrounding areas feature vast cosmic voids with far fewer galaxies. The Great Attractor, a gravitational anomaly in intergalactic space, is another fascinating feature that impacts the motion of galaxies in our region of the universe.
In contrast, areas like the Perseus-Pisces Supercluster showcase clusters of galaxies that are incredibly rich in various types of celestial bodies. The differences in density and distribution can provide insights into the formation and evolution of galaxies.
Moreover, recent studies have shown that the universe is expanding at an accelerating rate due to dark energy, which adds another layer of complexity to our understanding of regional dynamics. This expansion affects how we perceive distances and the relationships between various cosmic structures.
Significance and Impact
Understanding the observable universe is crucial for several reasons. First, it helps us answer fundamental questions about the nature of existence and our place in the cosmos. For instance, how did the universe begin, and what is its ultimate fate? These questions are deeply rooted in the fabric of human curiosity and scientific inquiry.
Furthermore, the study of the universe’s structure has practical implications, including advancements in technology and methods used in navigation, telecommunications, and even data analysis. The techniques developed for astrophysical research often find applications in other fields, showcasing the interconnectivity of scientific disciplines.
As we look to the future, ongoing projects like the James Webb Space Telescope promise to provide even more detailed insights into the universe’s structure, potentially reshaping our understanding of cosmic evolution. With each discovery, we move closer to unraveling the mysteries of not just our galaxy, but the entire cosmos.
In conclusion, the logarithmic map serves as a powerful tool for visualizing the universe and understanding its complex architecture. The scale and detail it presents allow us to appreciate the vastness of the universe while encouraging further exploration and inquiry into the nature of reality itself.
Visualization Details
- Published
- September 2, 2025
- Views
- 90
Comments
Loading comments...