public safety Maps
20 geographic visualizations tagged with "public safety"
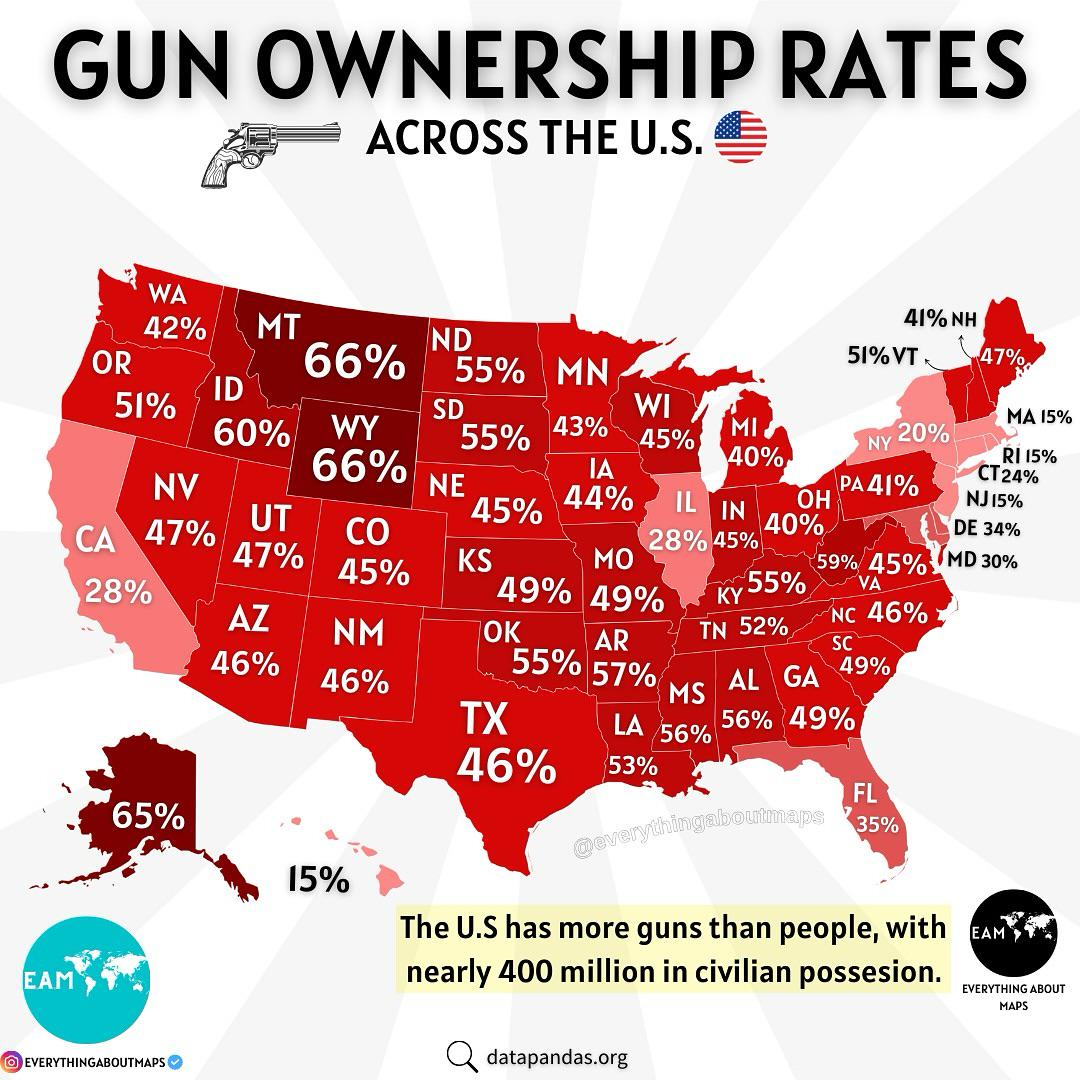
Gun Ownership in the U.S. Map
The "Gun Ownership in the U.S. Map" provides a compelling visual representation of firearm ownership across the United S...
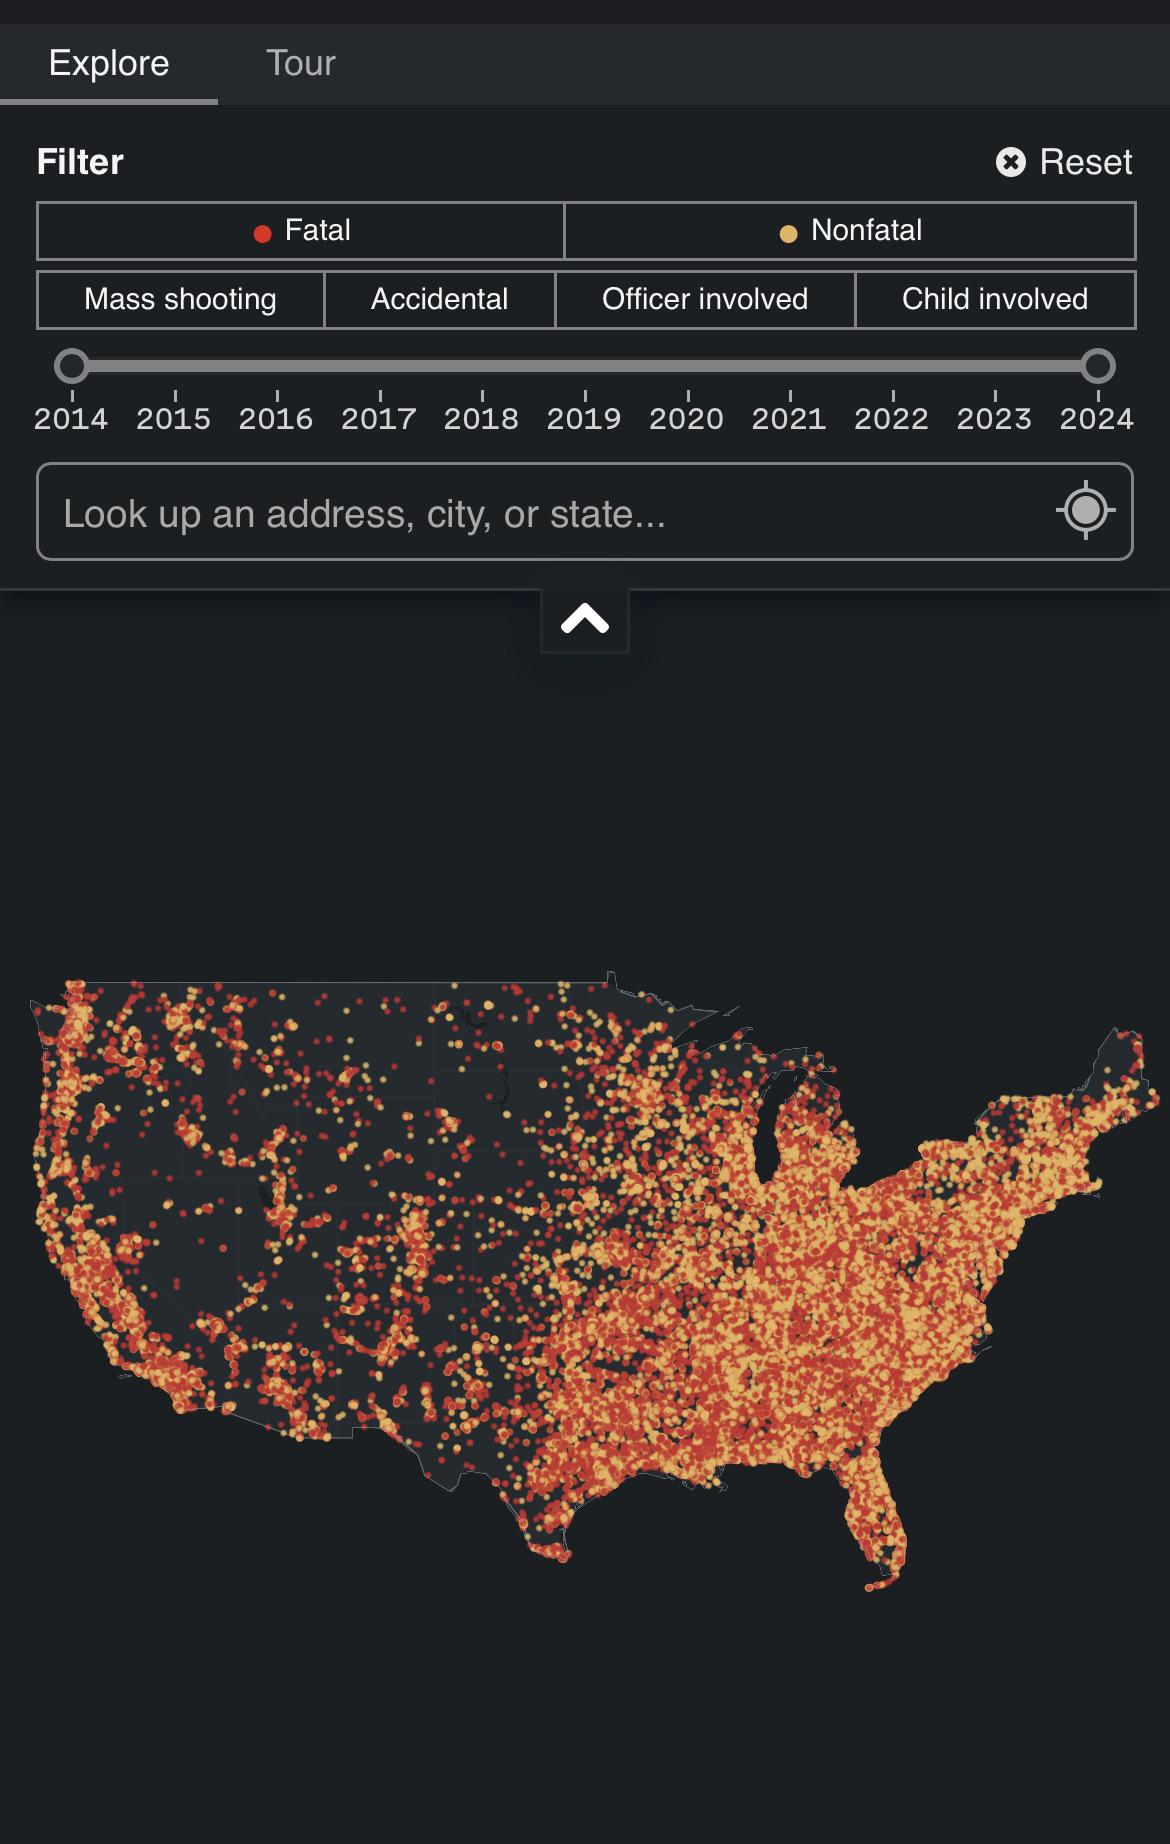
Gun Violence Map of America
The "Interactive Atlas of American Gun Violence" provides a detailed visualization of shootings across the United States...
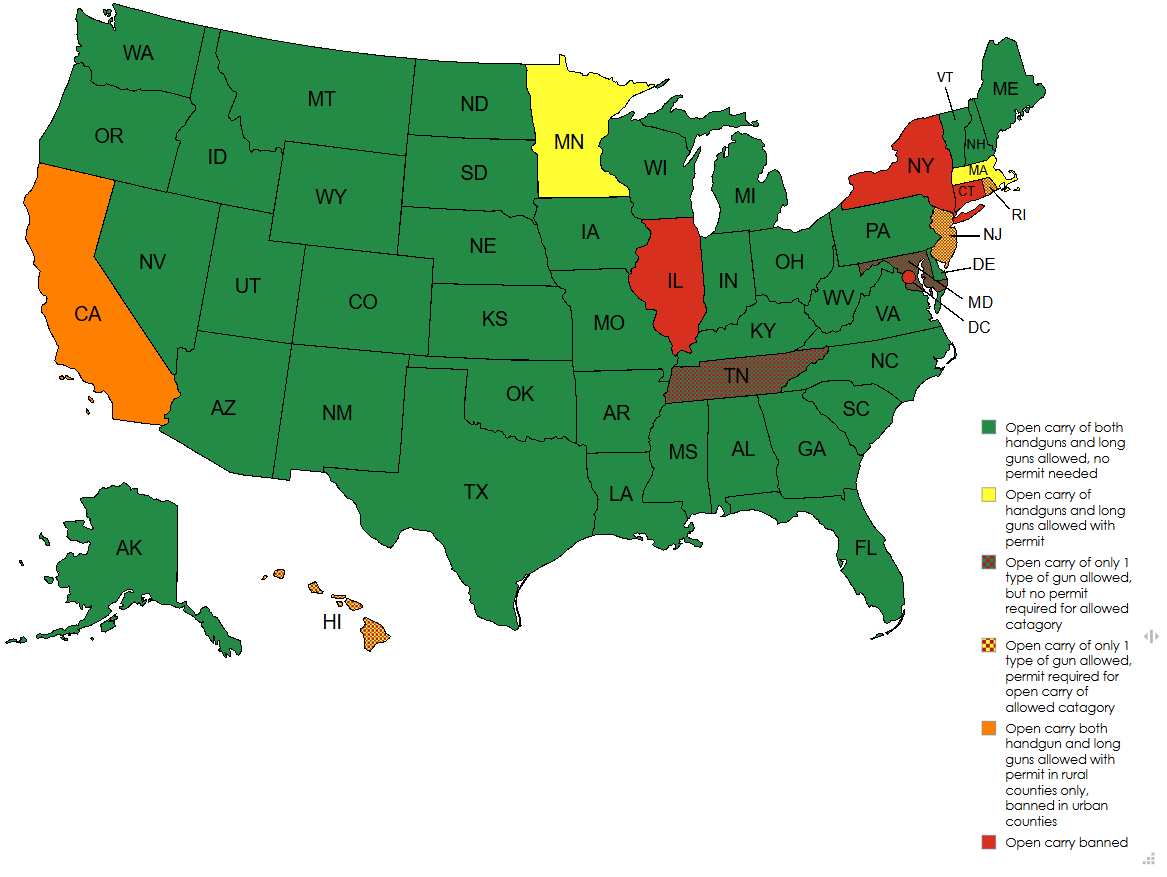
Current Open Carry Laws in the US by State Map
The "Current Open Carry Laws in the US by State Map" provides a comprehensive overview of the legal landscape regarding ...
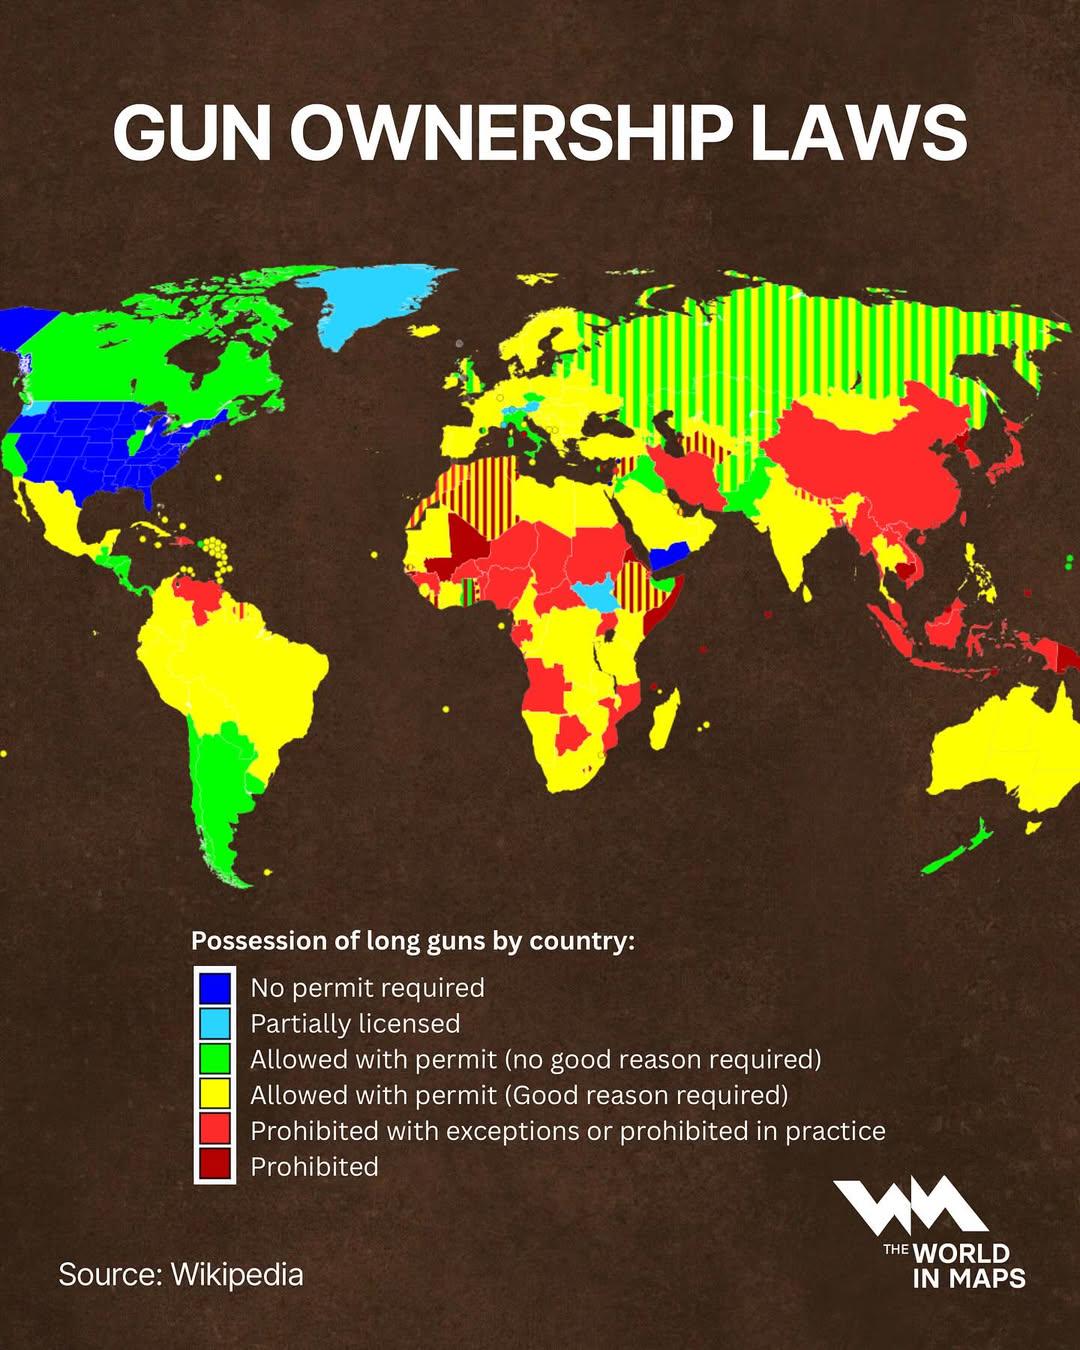
Gun Ownership Laws Worldwide Map
The "Gun Ownership Laws Worldwide Map" offers a comprehensive visualization of the varying legal frameworks governing fi...
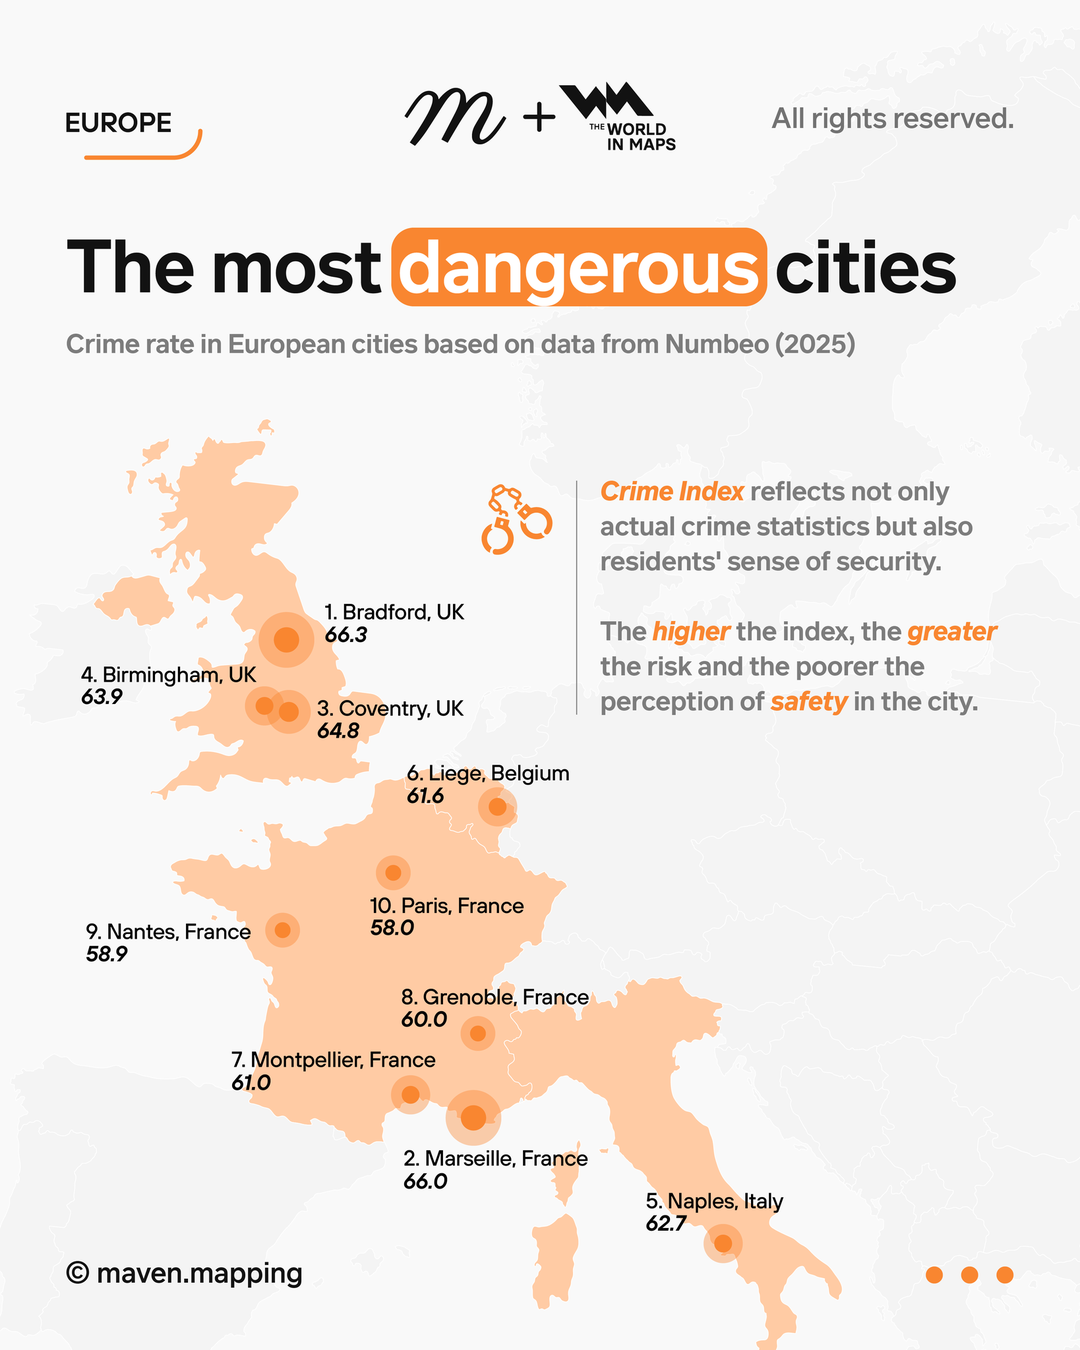
Crime Rate Map of Europe's Most Dangerous Cities
The visualization titled "The Most Dangerous Cities in Europe by Crime Rate" provides a comprehensive overview of urban ...
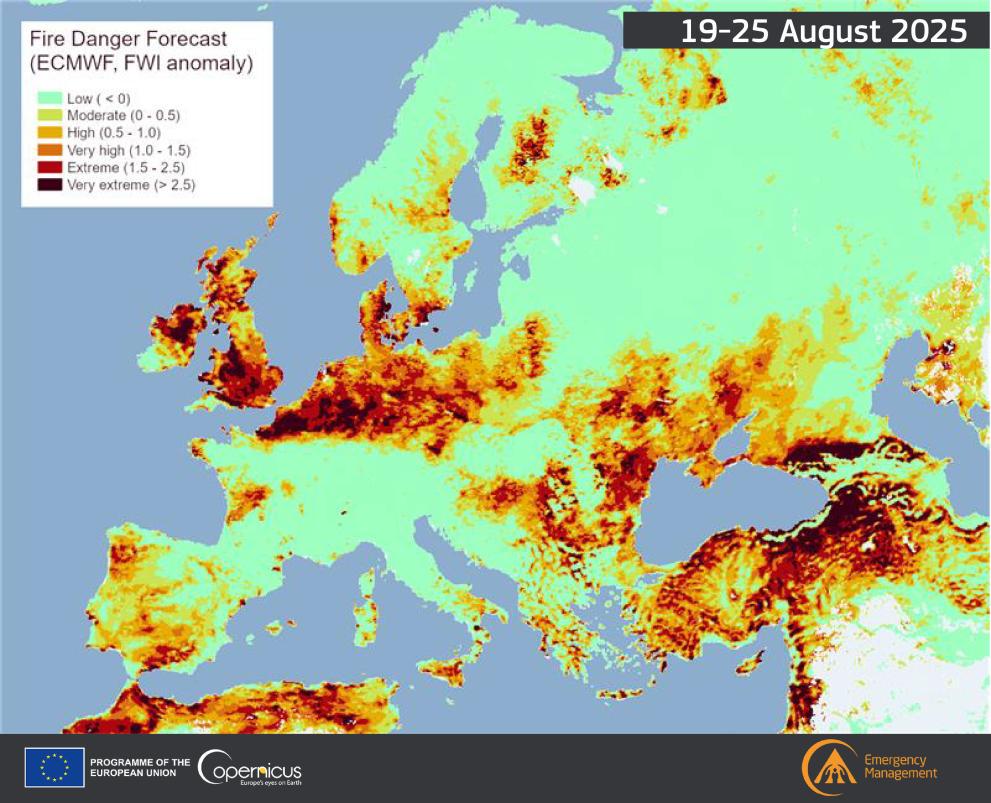
Fire Danger Map of Current Europe
The "Fire Danger Map of Current Europe" provides a crucial snapshot of fire risk levels across various regions in Europe...
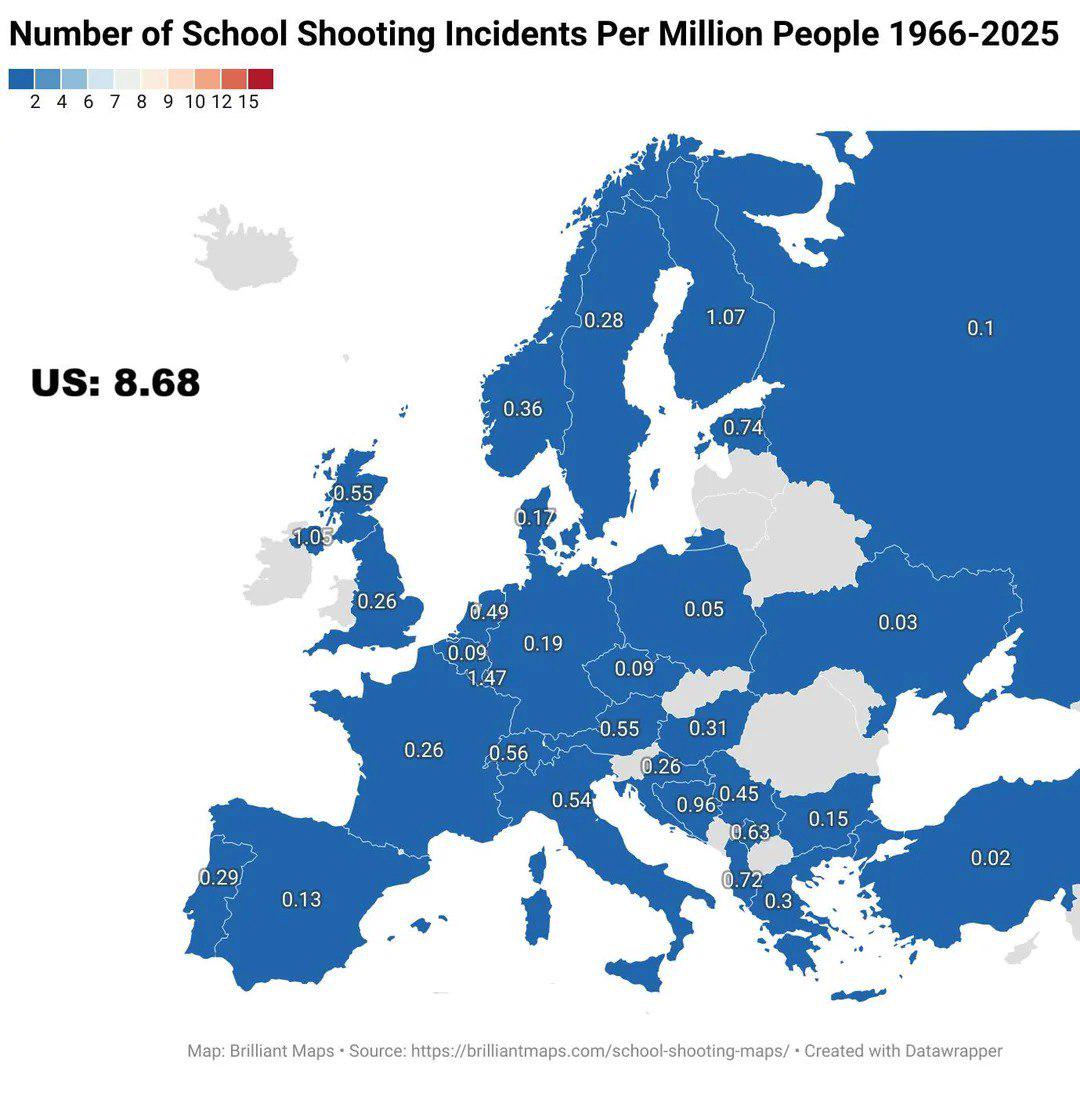
School Shooting Incidents Per Million People Map
The map titled "Number of School Shooting Incidents per Million People 1966-2025" provides a stark visual representation...
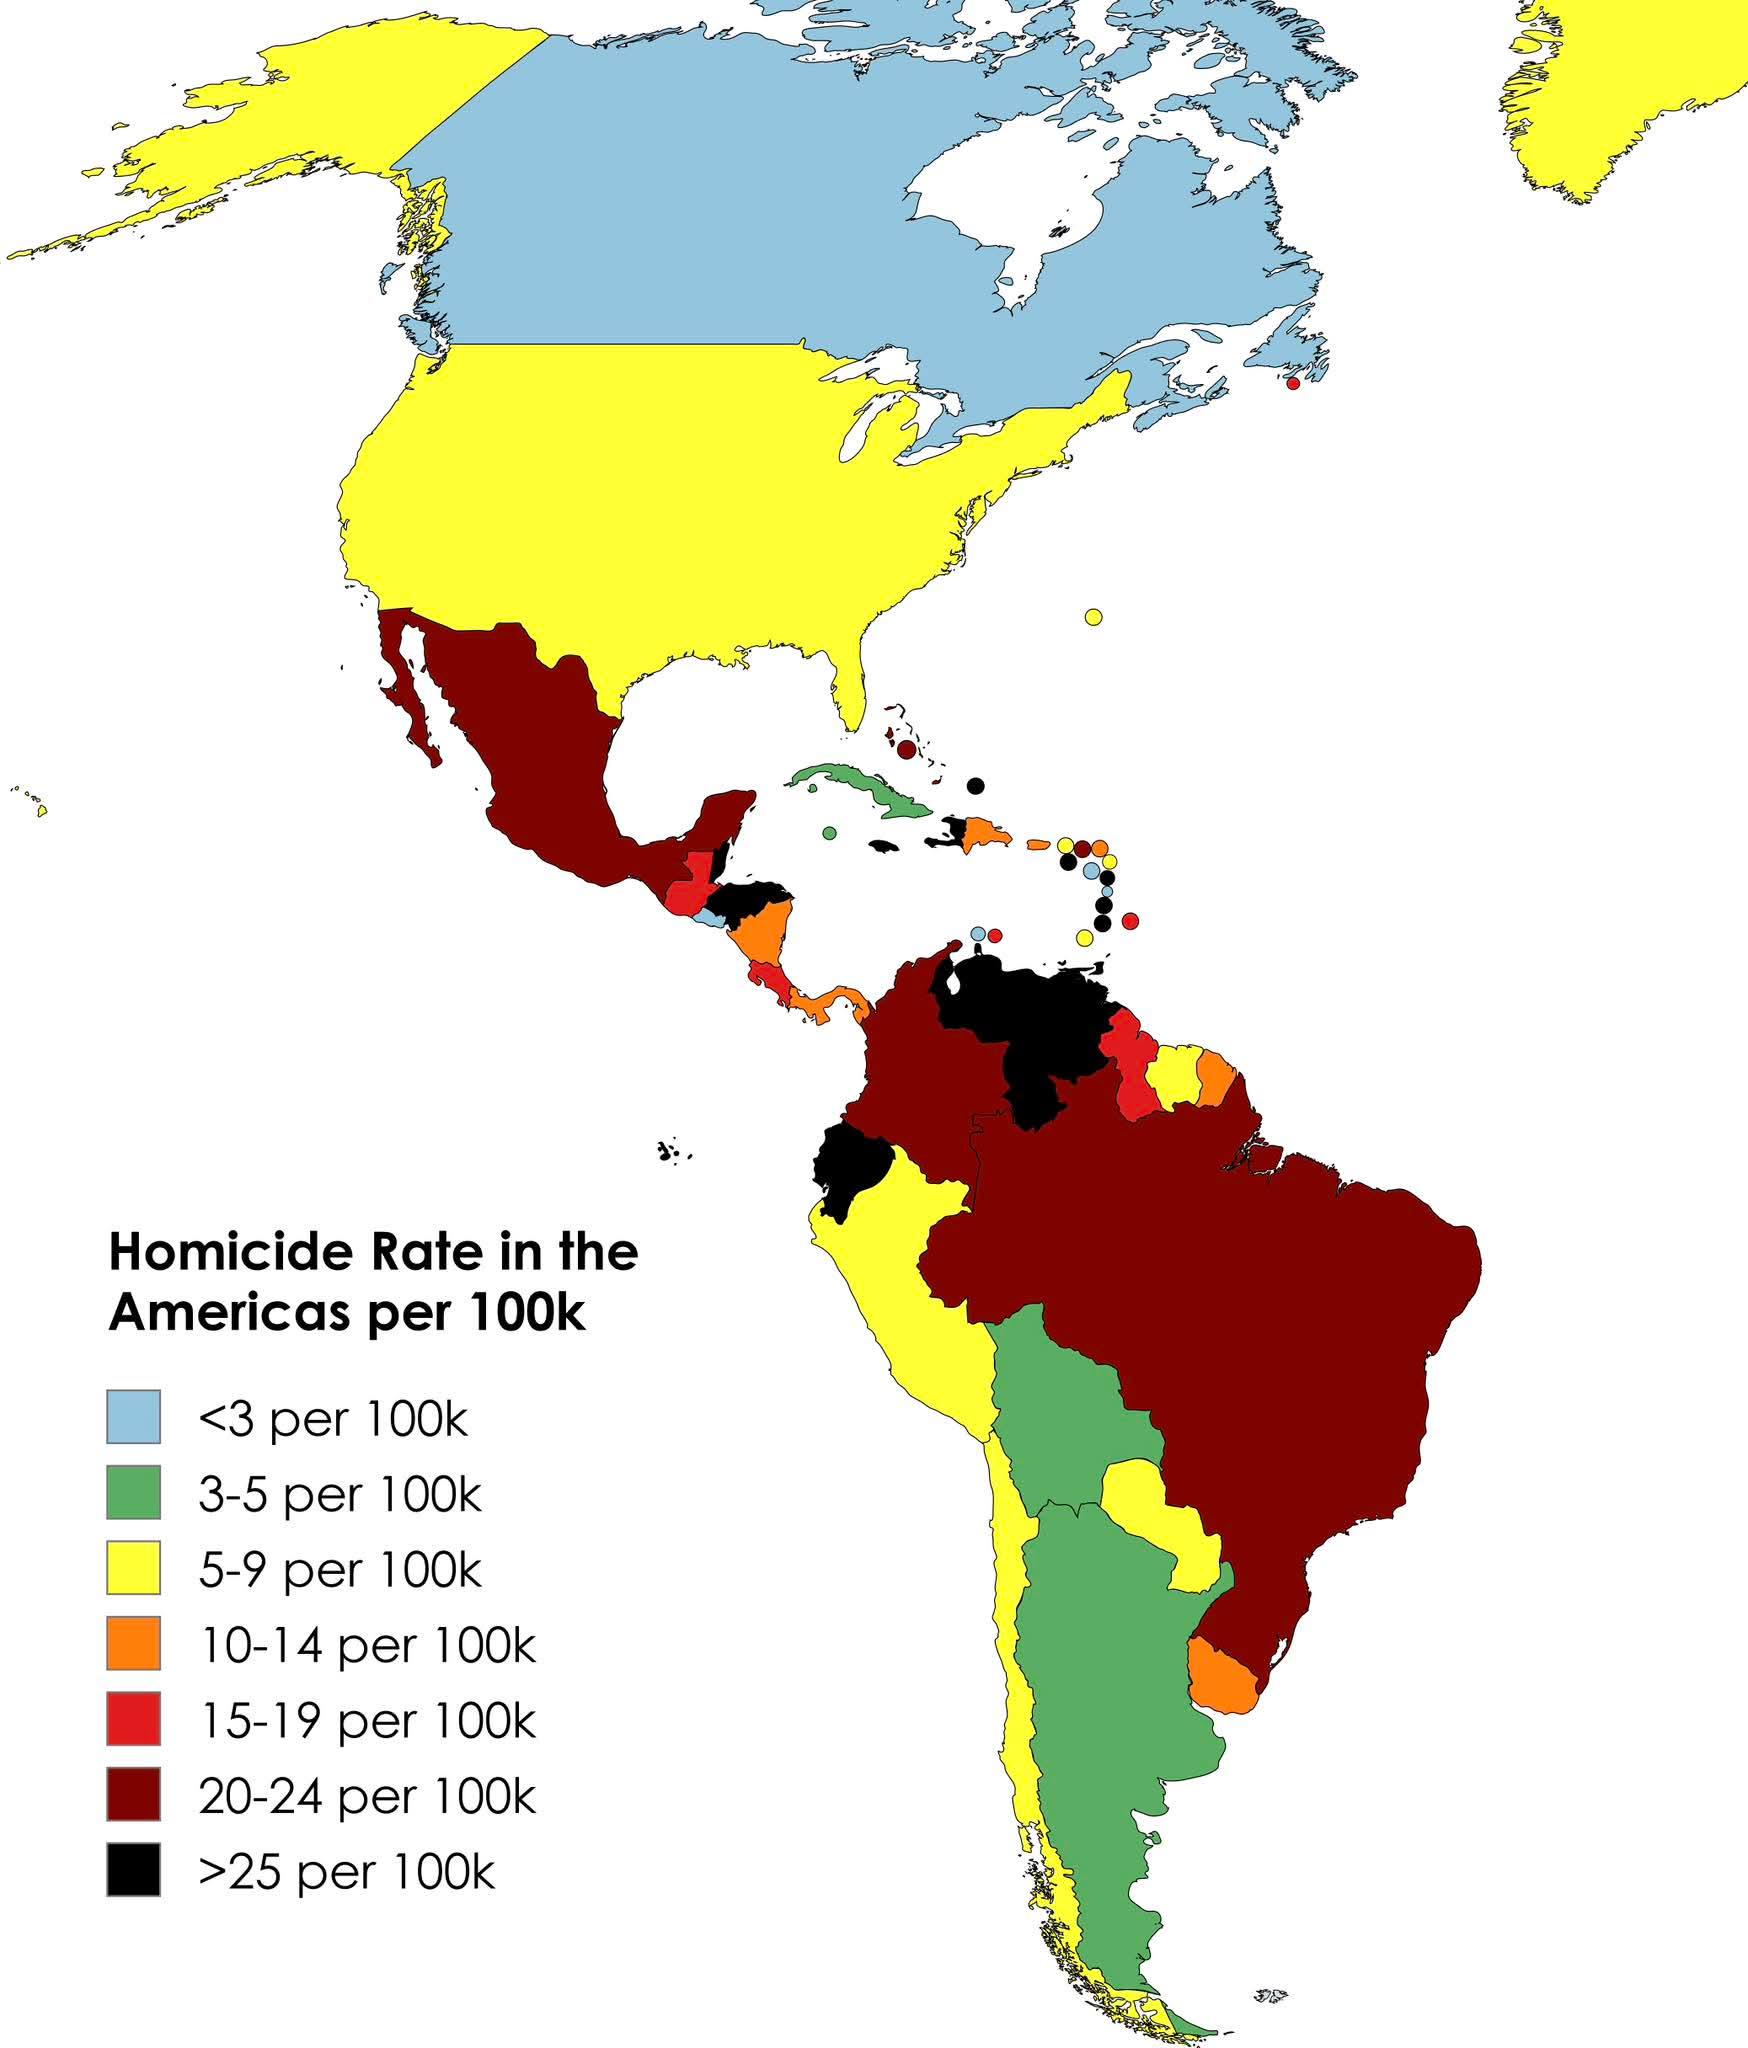
Homicide Rates in the Americas Map
The "Homicide Rates in the Americas Map" visually represents the varying homicide rates across different countries withi...
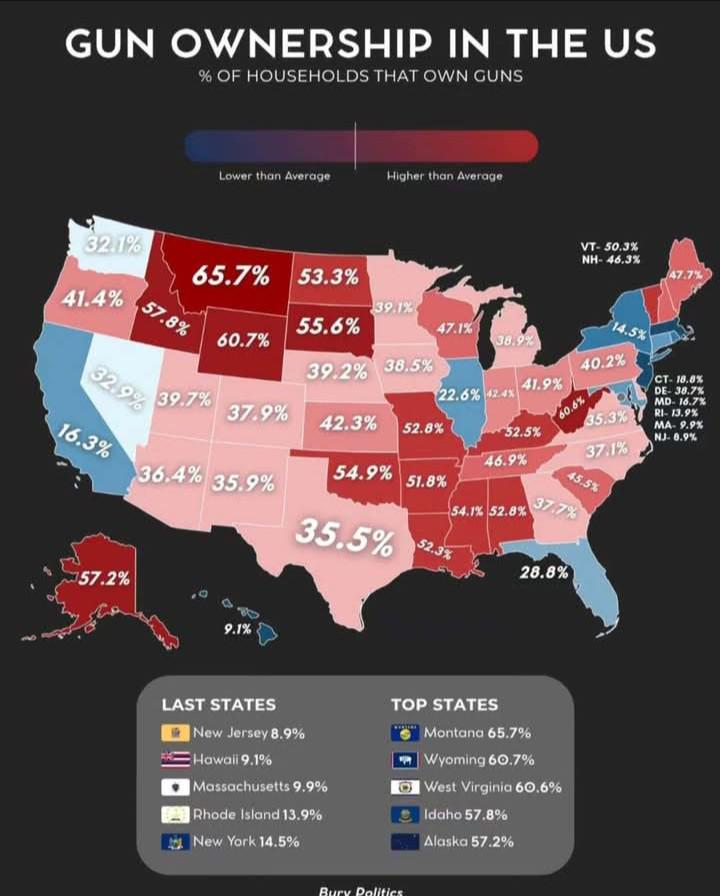
Gun Ownership Per Household in the US Map
The visualization titled 'Rate of Gun Ownership per Household in the US' provides a clear representation of the percenta...
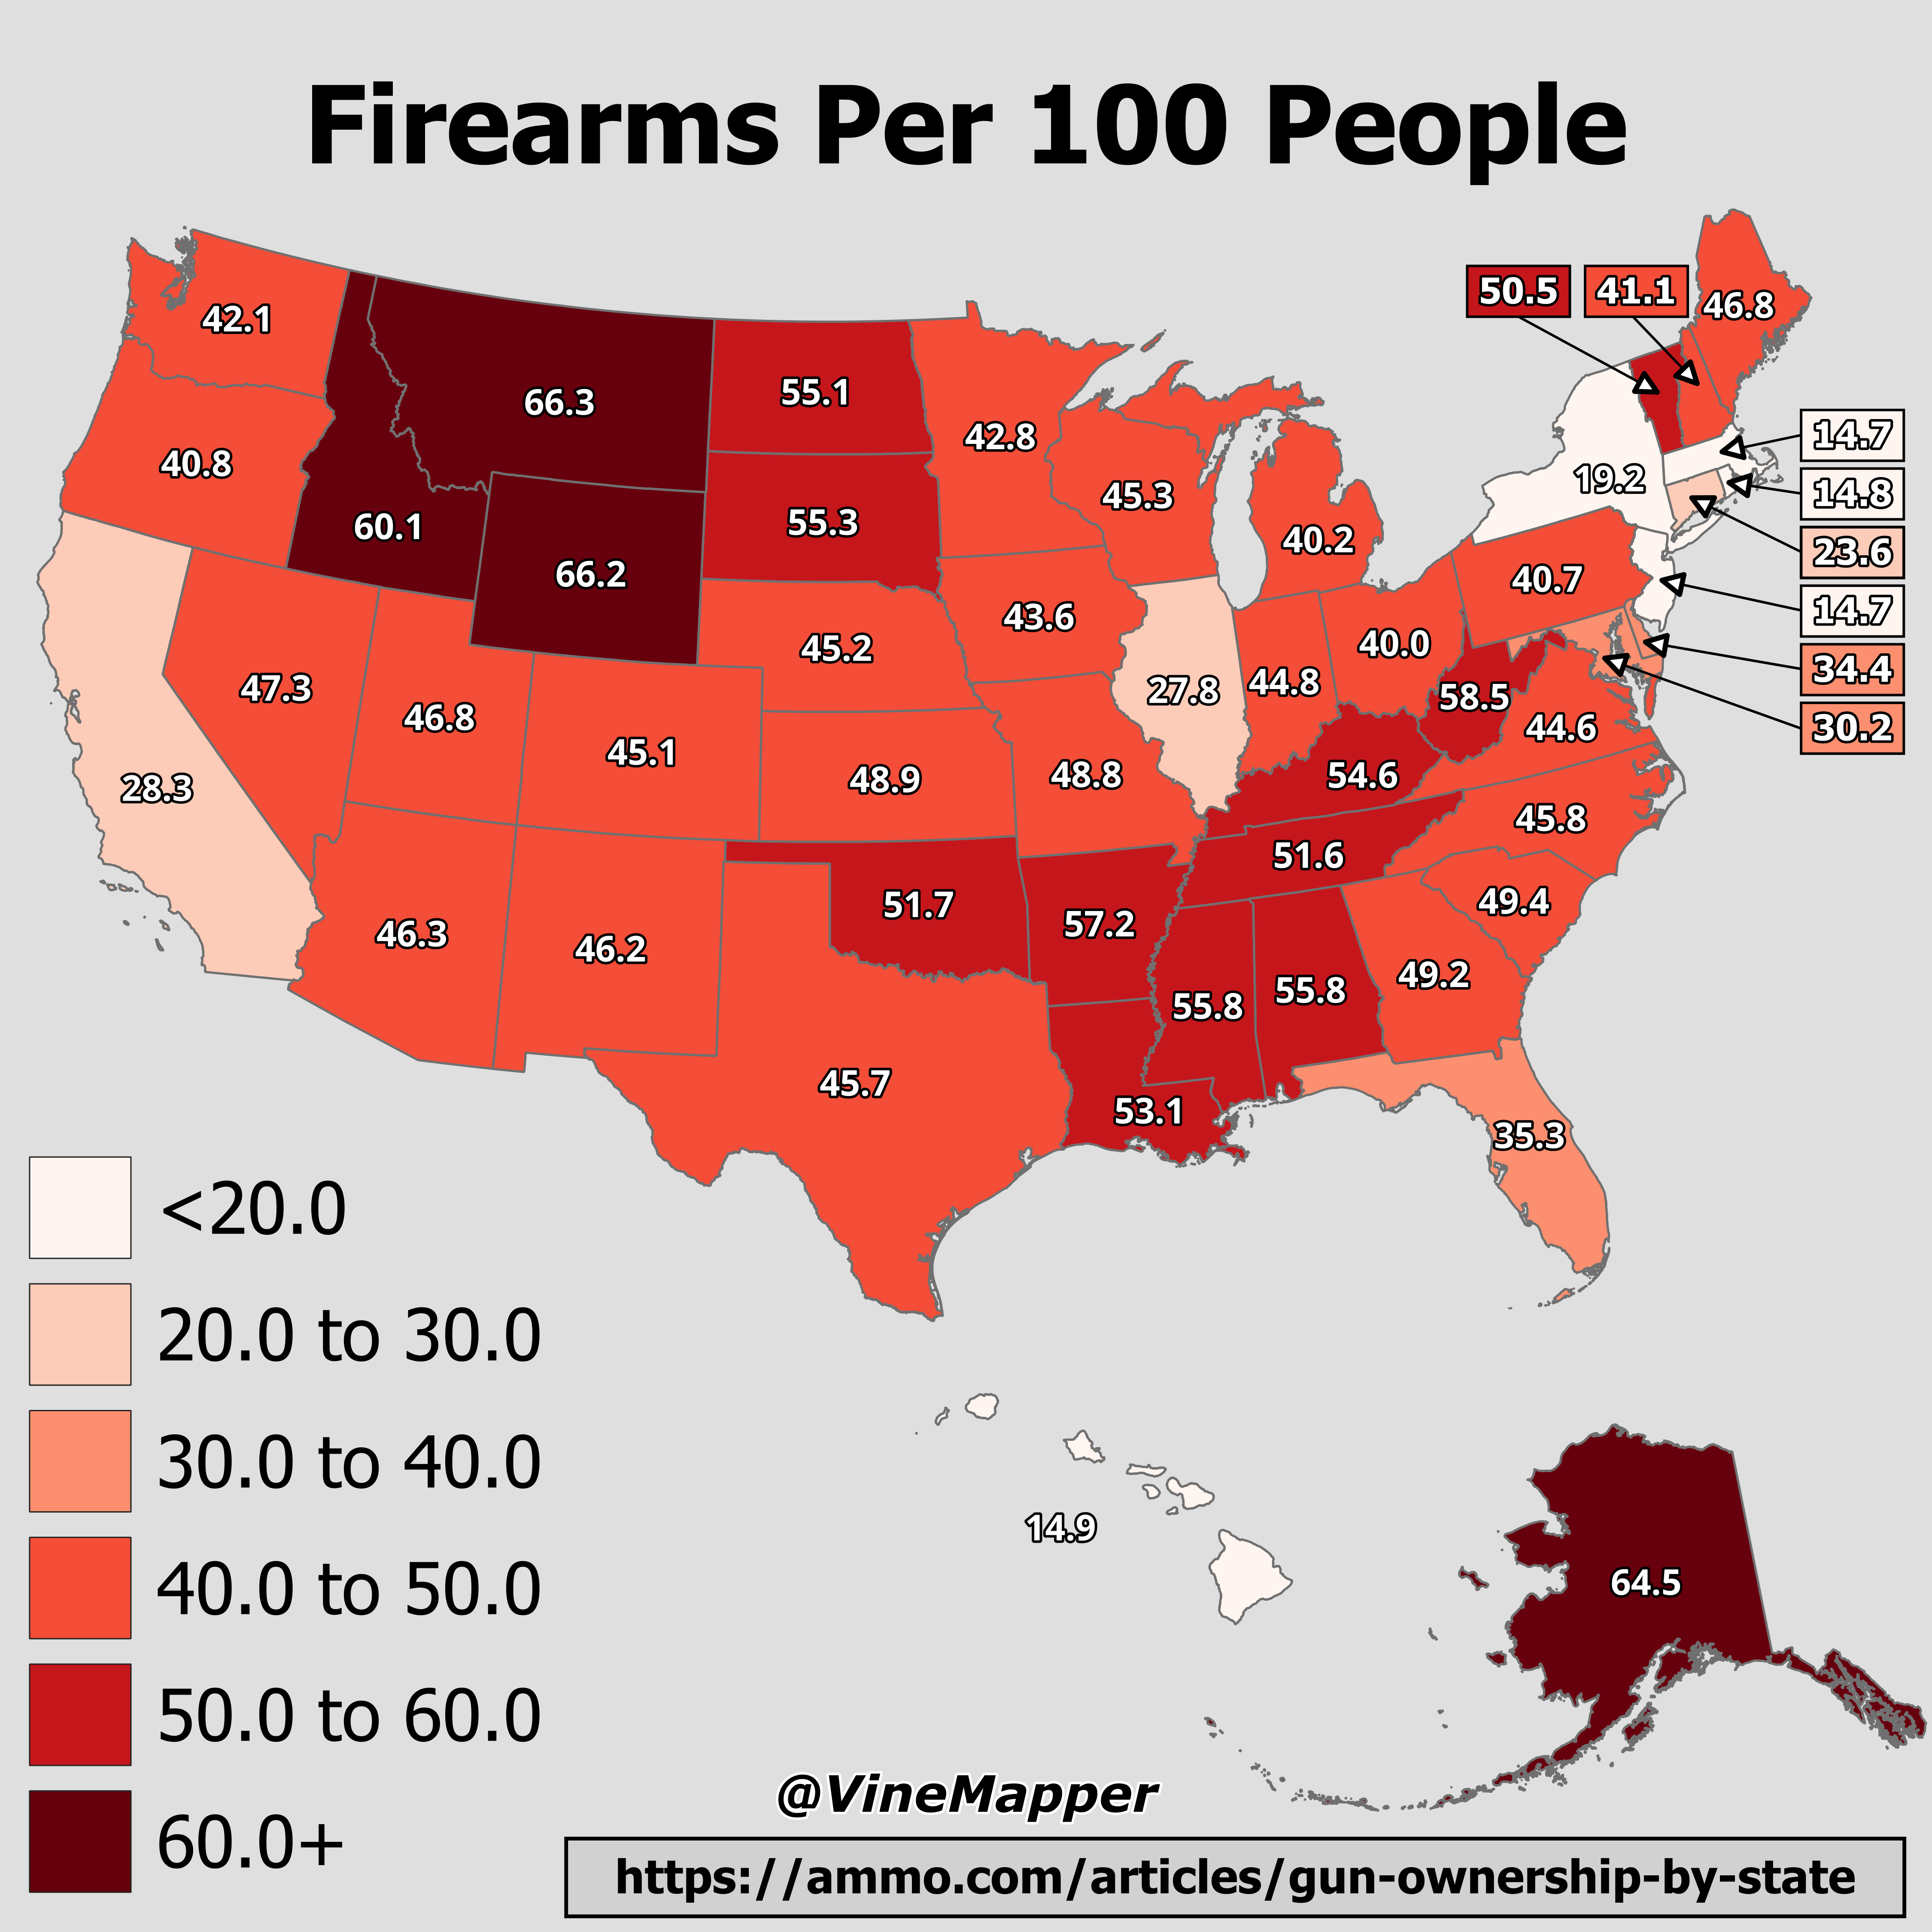
Firearms Per 100 People Map
The "Firearms Per 100 People" map provides a visual representation of the prevalence of civilian firearm ownership acros...
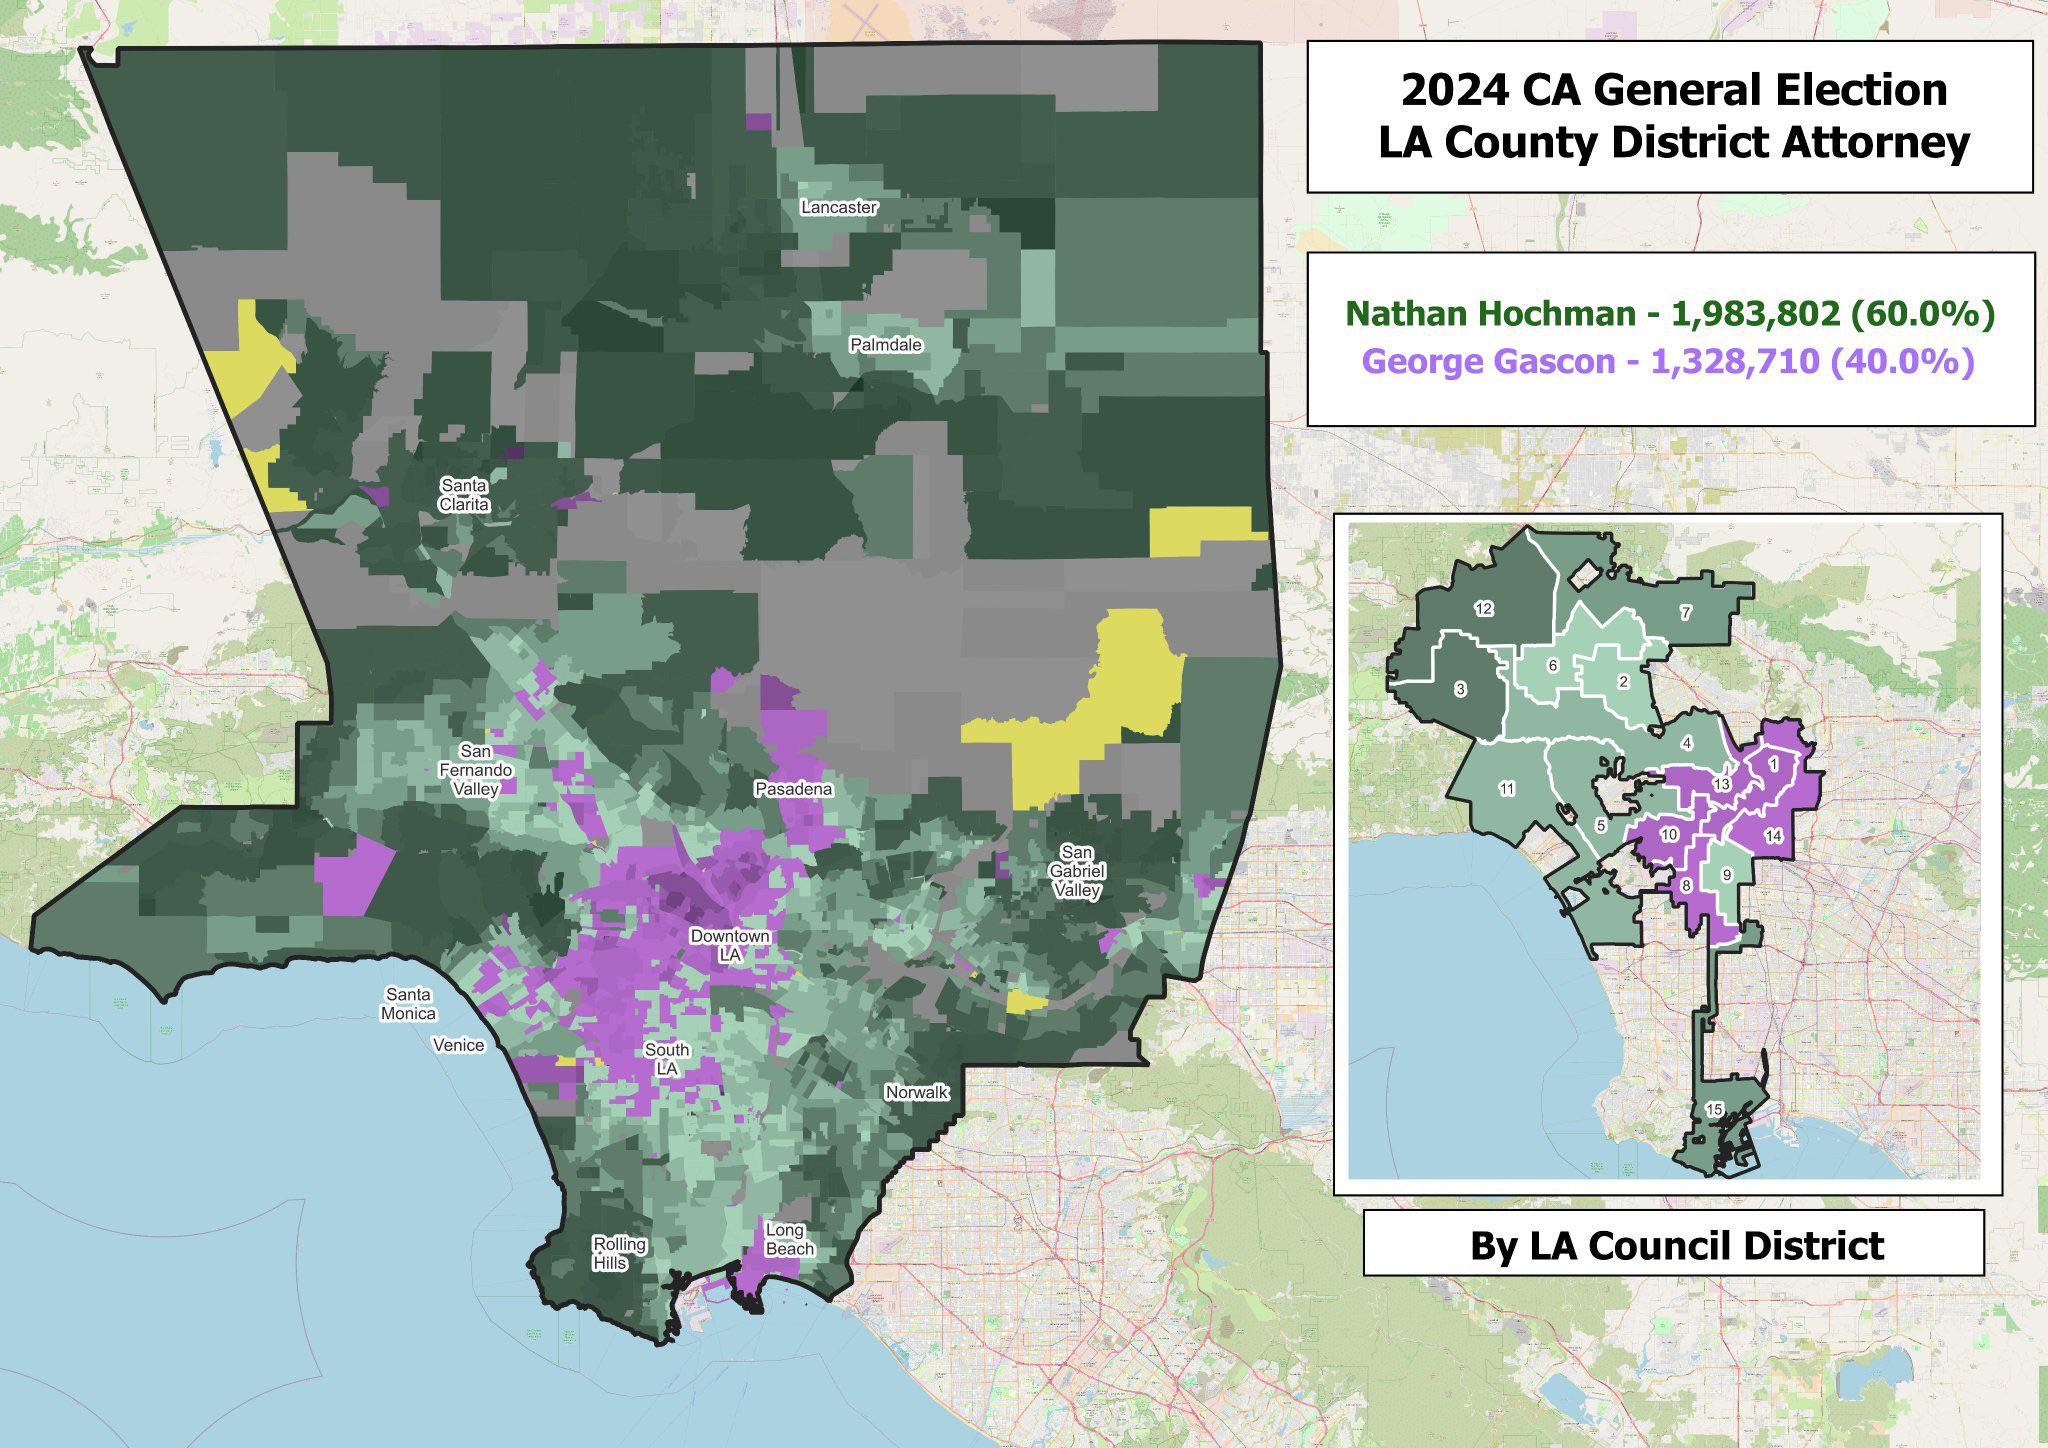
Election Map of Nathan Hochman vs. George Gascón
Interestingly, voter turnout in this election was significant, with a noticeable shift in demographics participating in ...
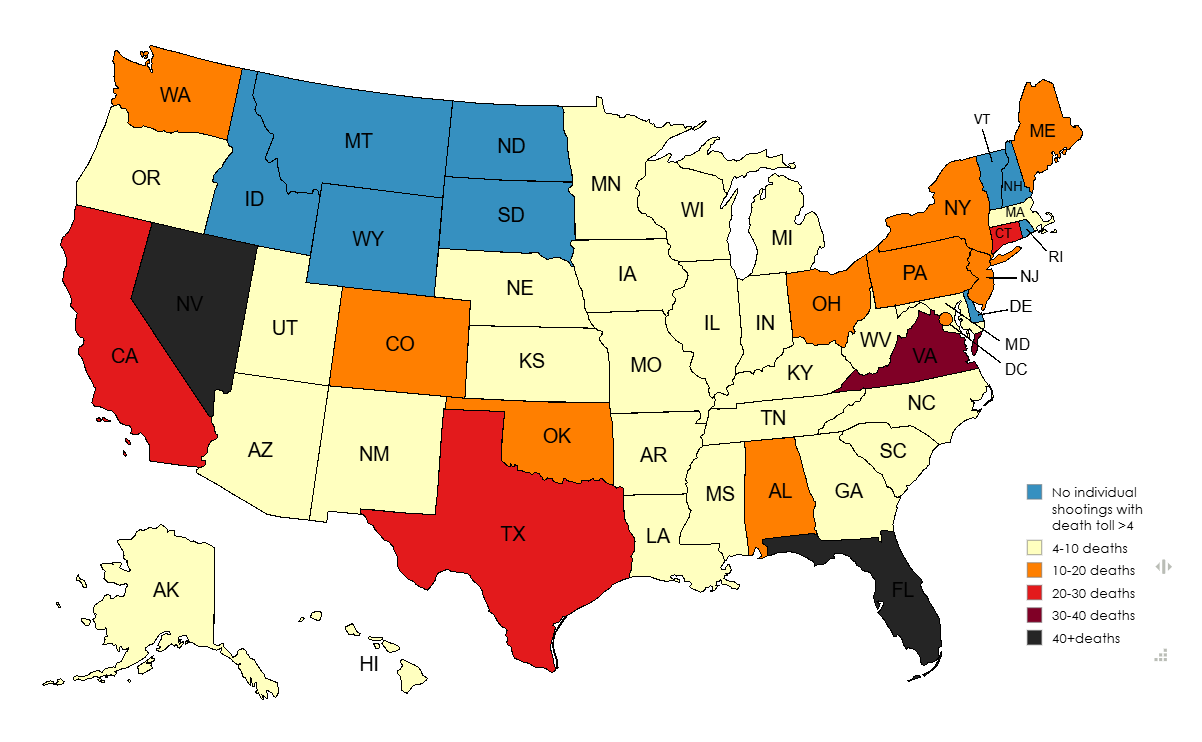
Deadliest Mass Shooting by US State Map
The "Deadliest Mass Shooting by US State Map" presents a stark and sobering visualization of the most tragic mass shooti...
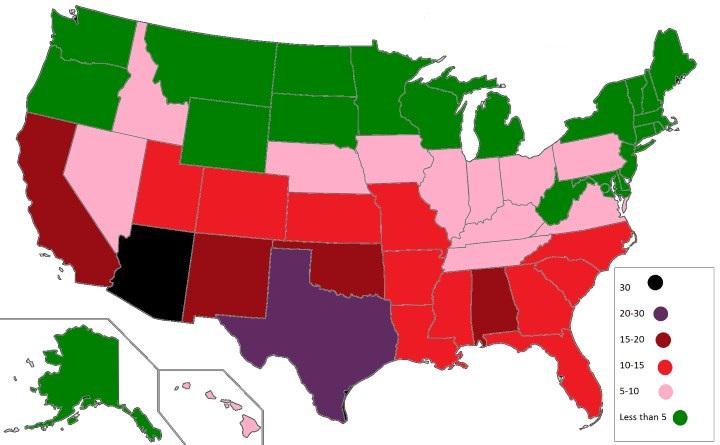
U.S. States with the Highest Number of Venomous Animals Map
The visualization titled "U.S. States with the Highest Number of Venomous Animals Map" provides a striking look at the d...
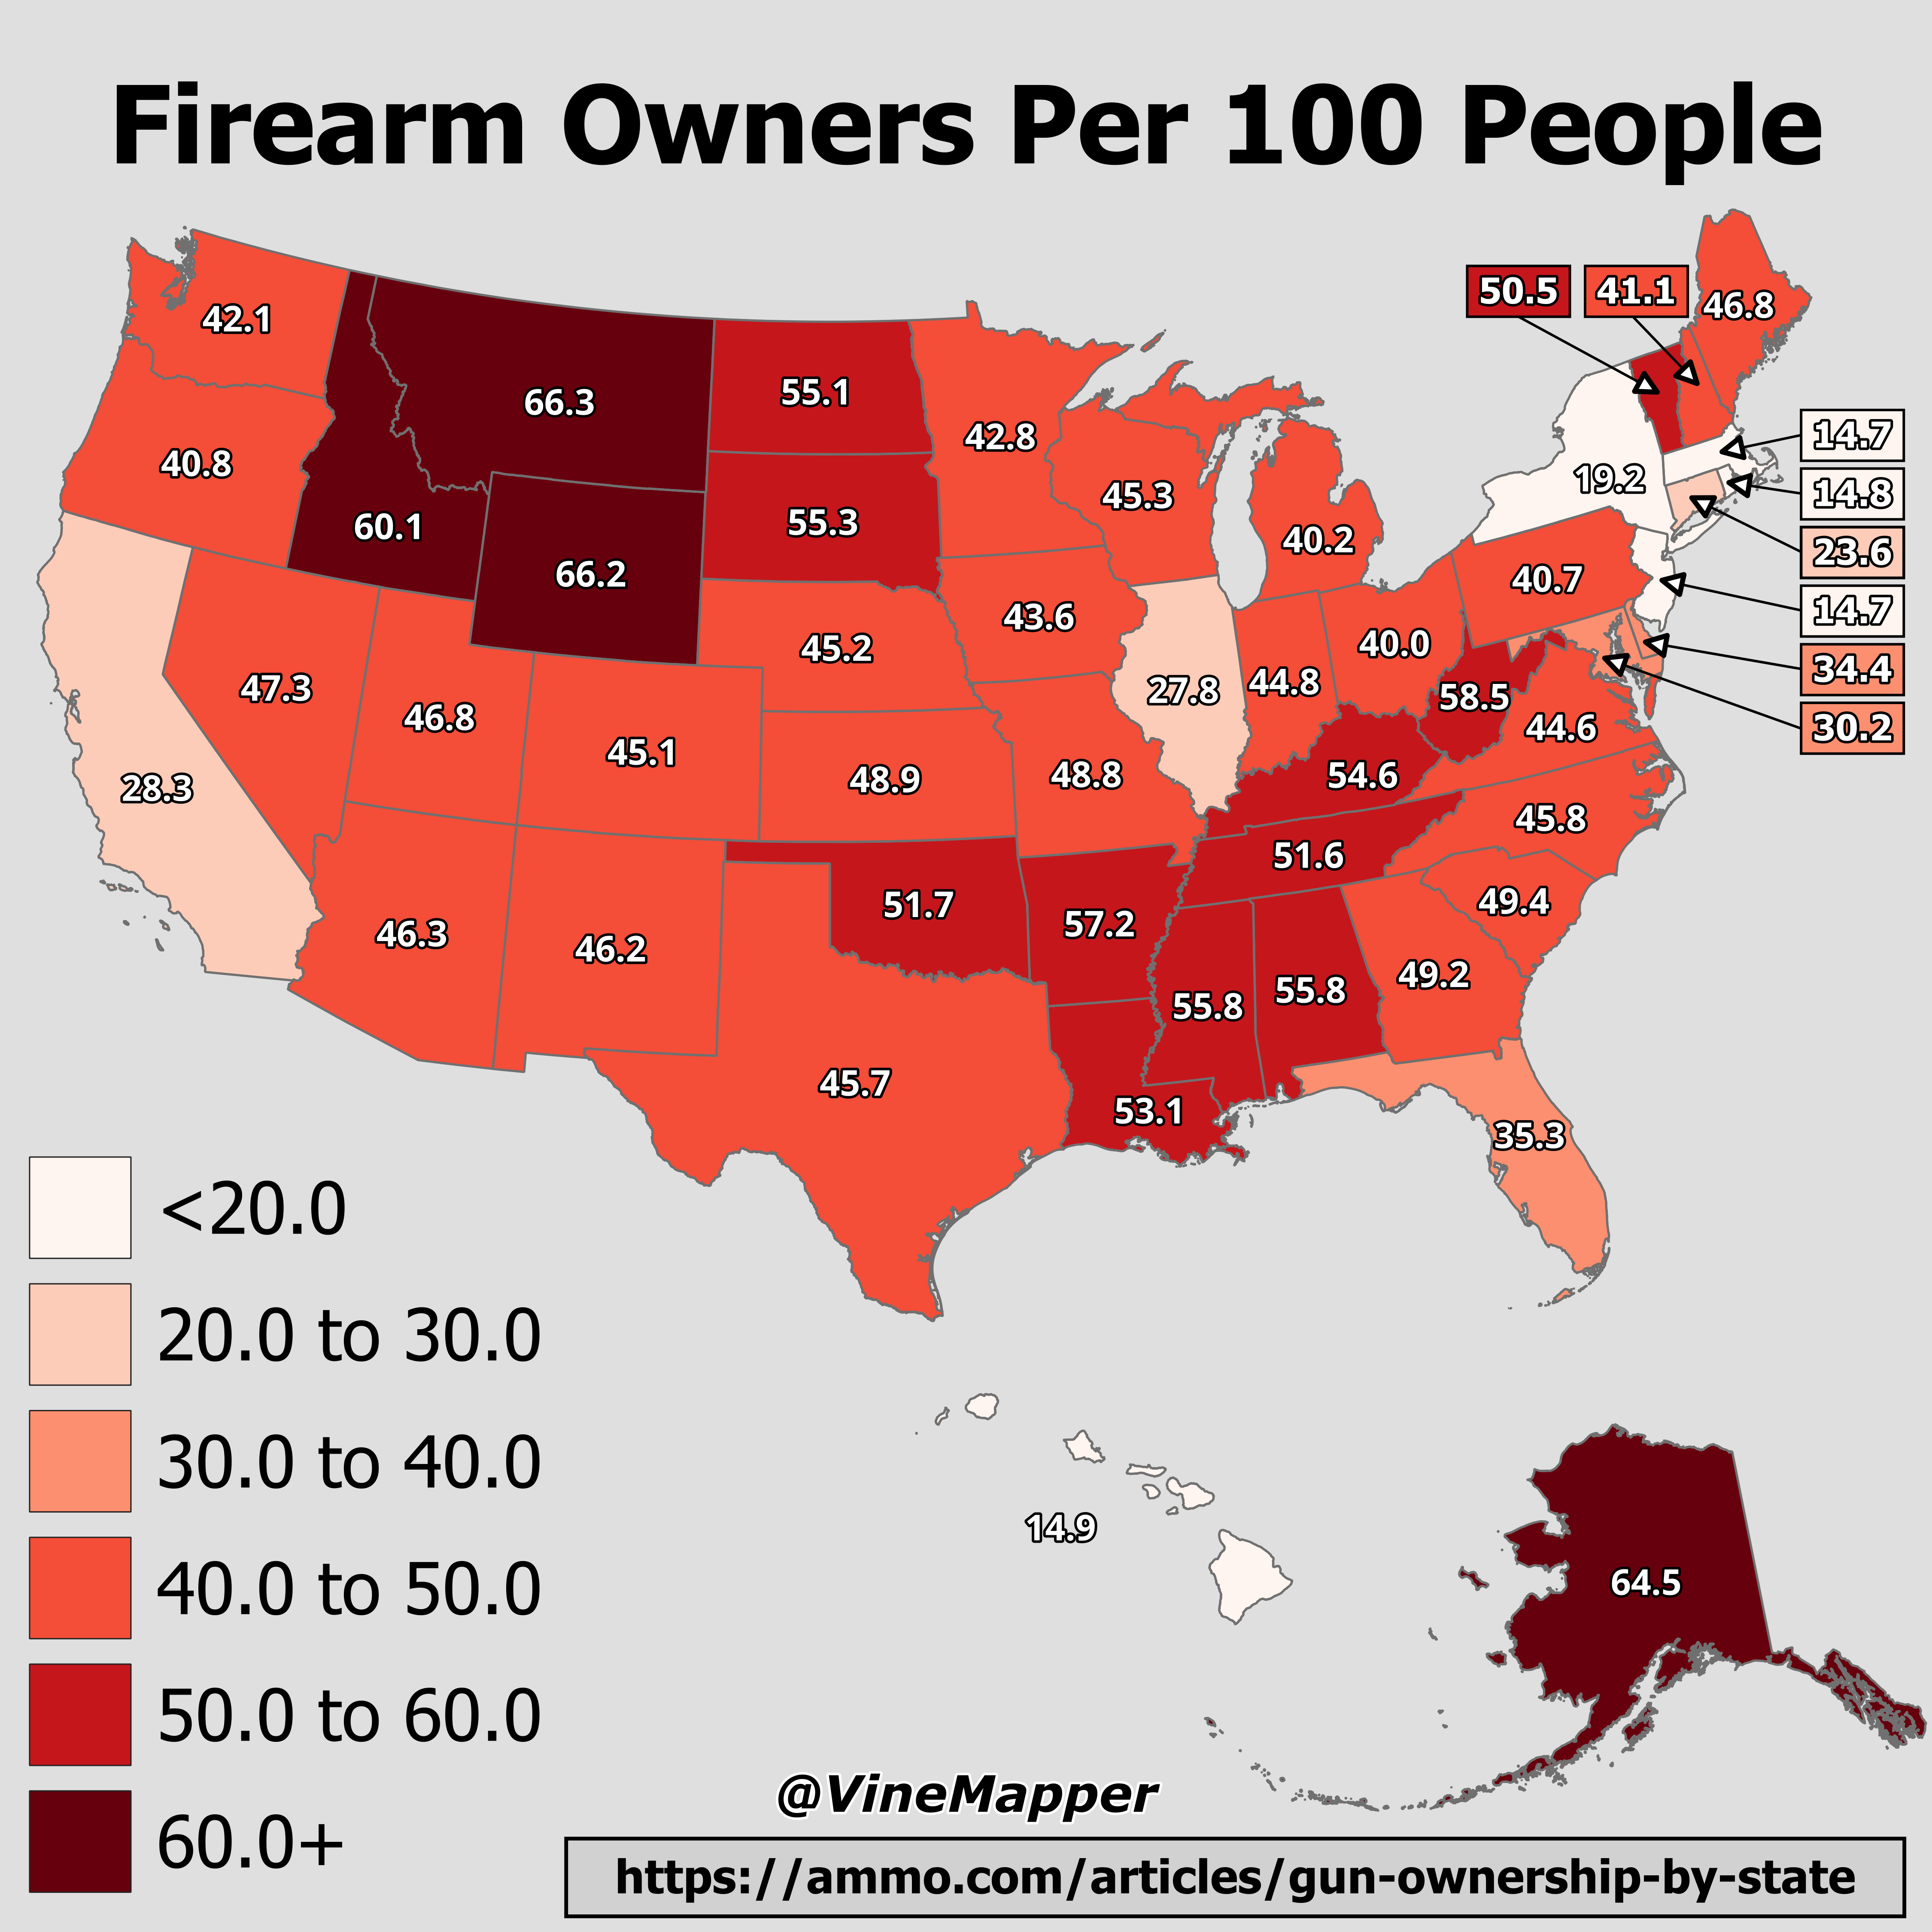
Firearm Owners Per 100 People Map
The "Firearm Owners Per 100 People Map" offers a compelling visual representation of firearm ownership rates across diff...
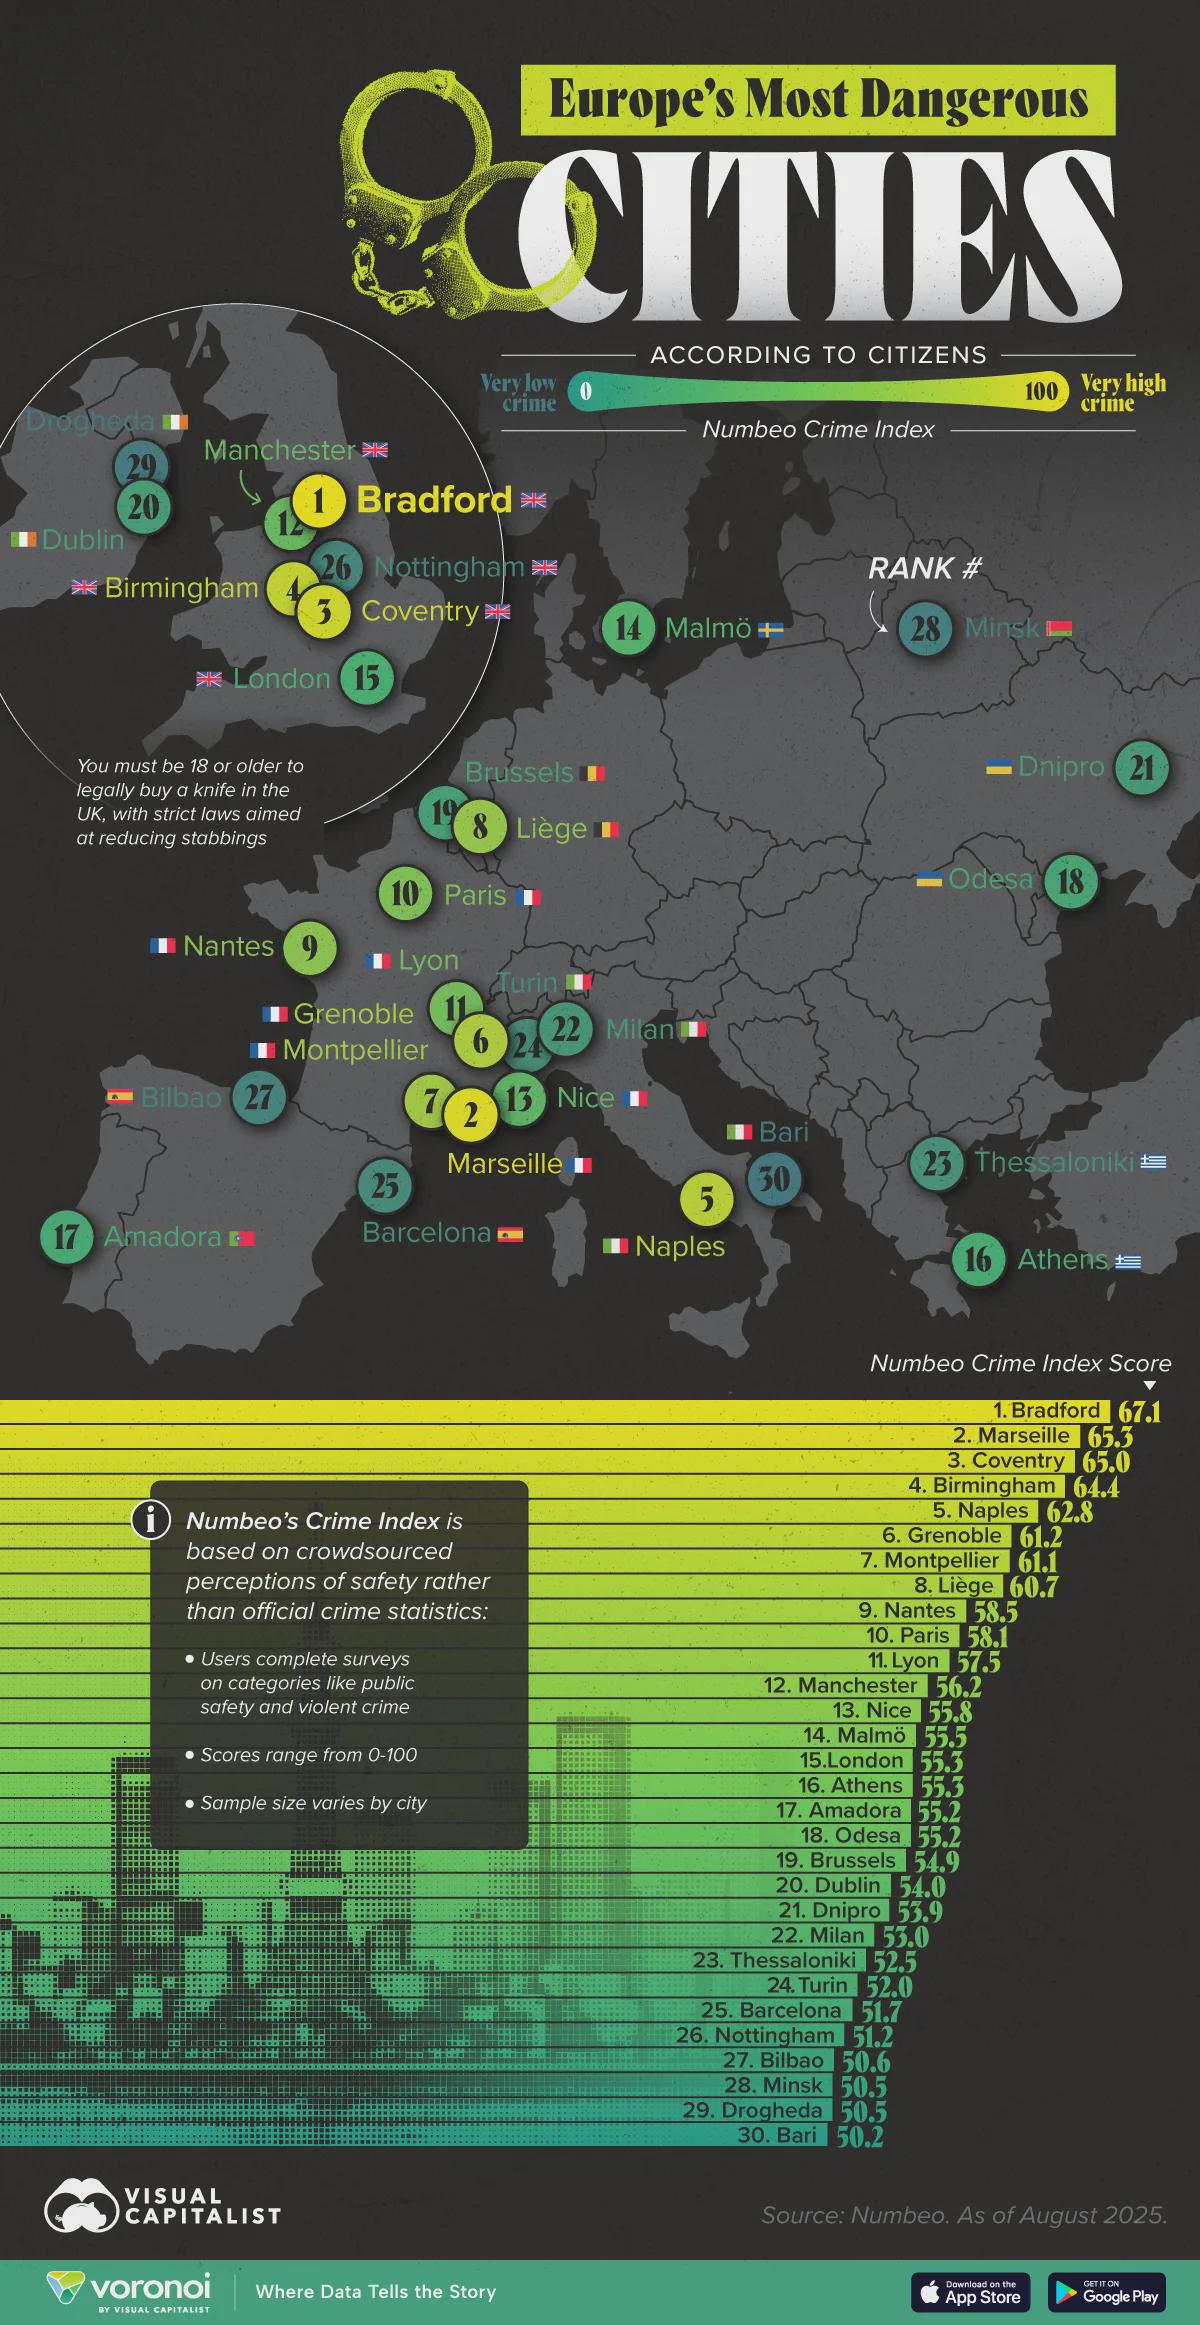
Most Dangerous European Cities Map
The \...
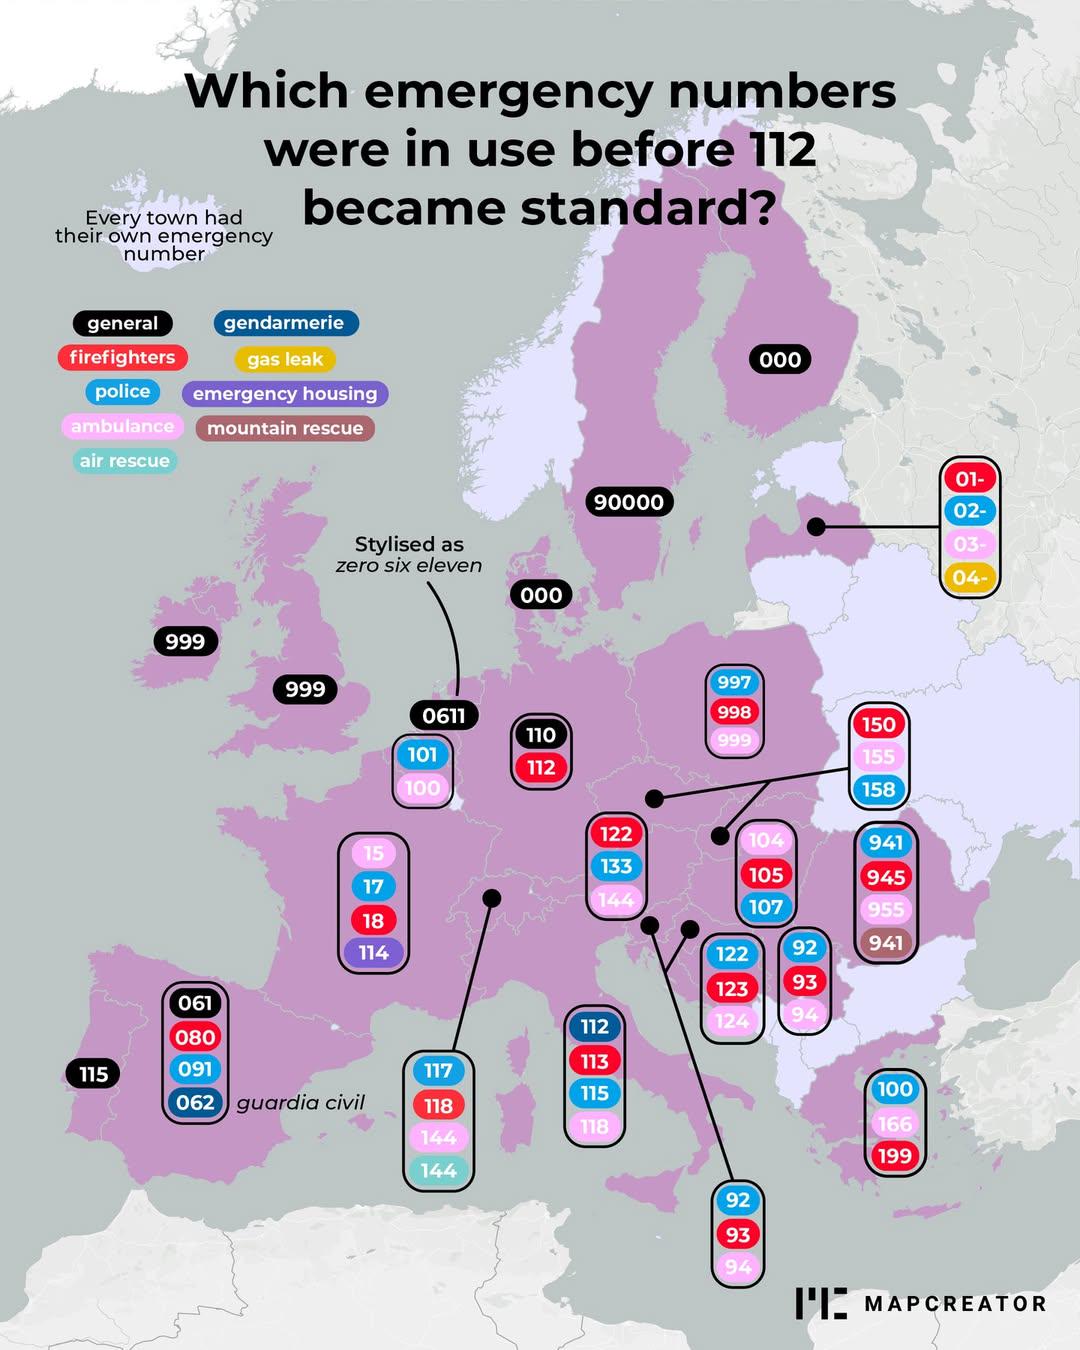
Emergency Numbers Before 112 Standardization Map
This map visualizes the various emergency numbers that were in use across different countries before the adoption of the...
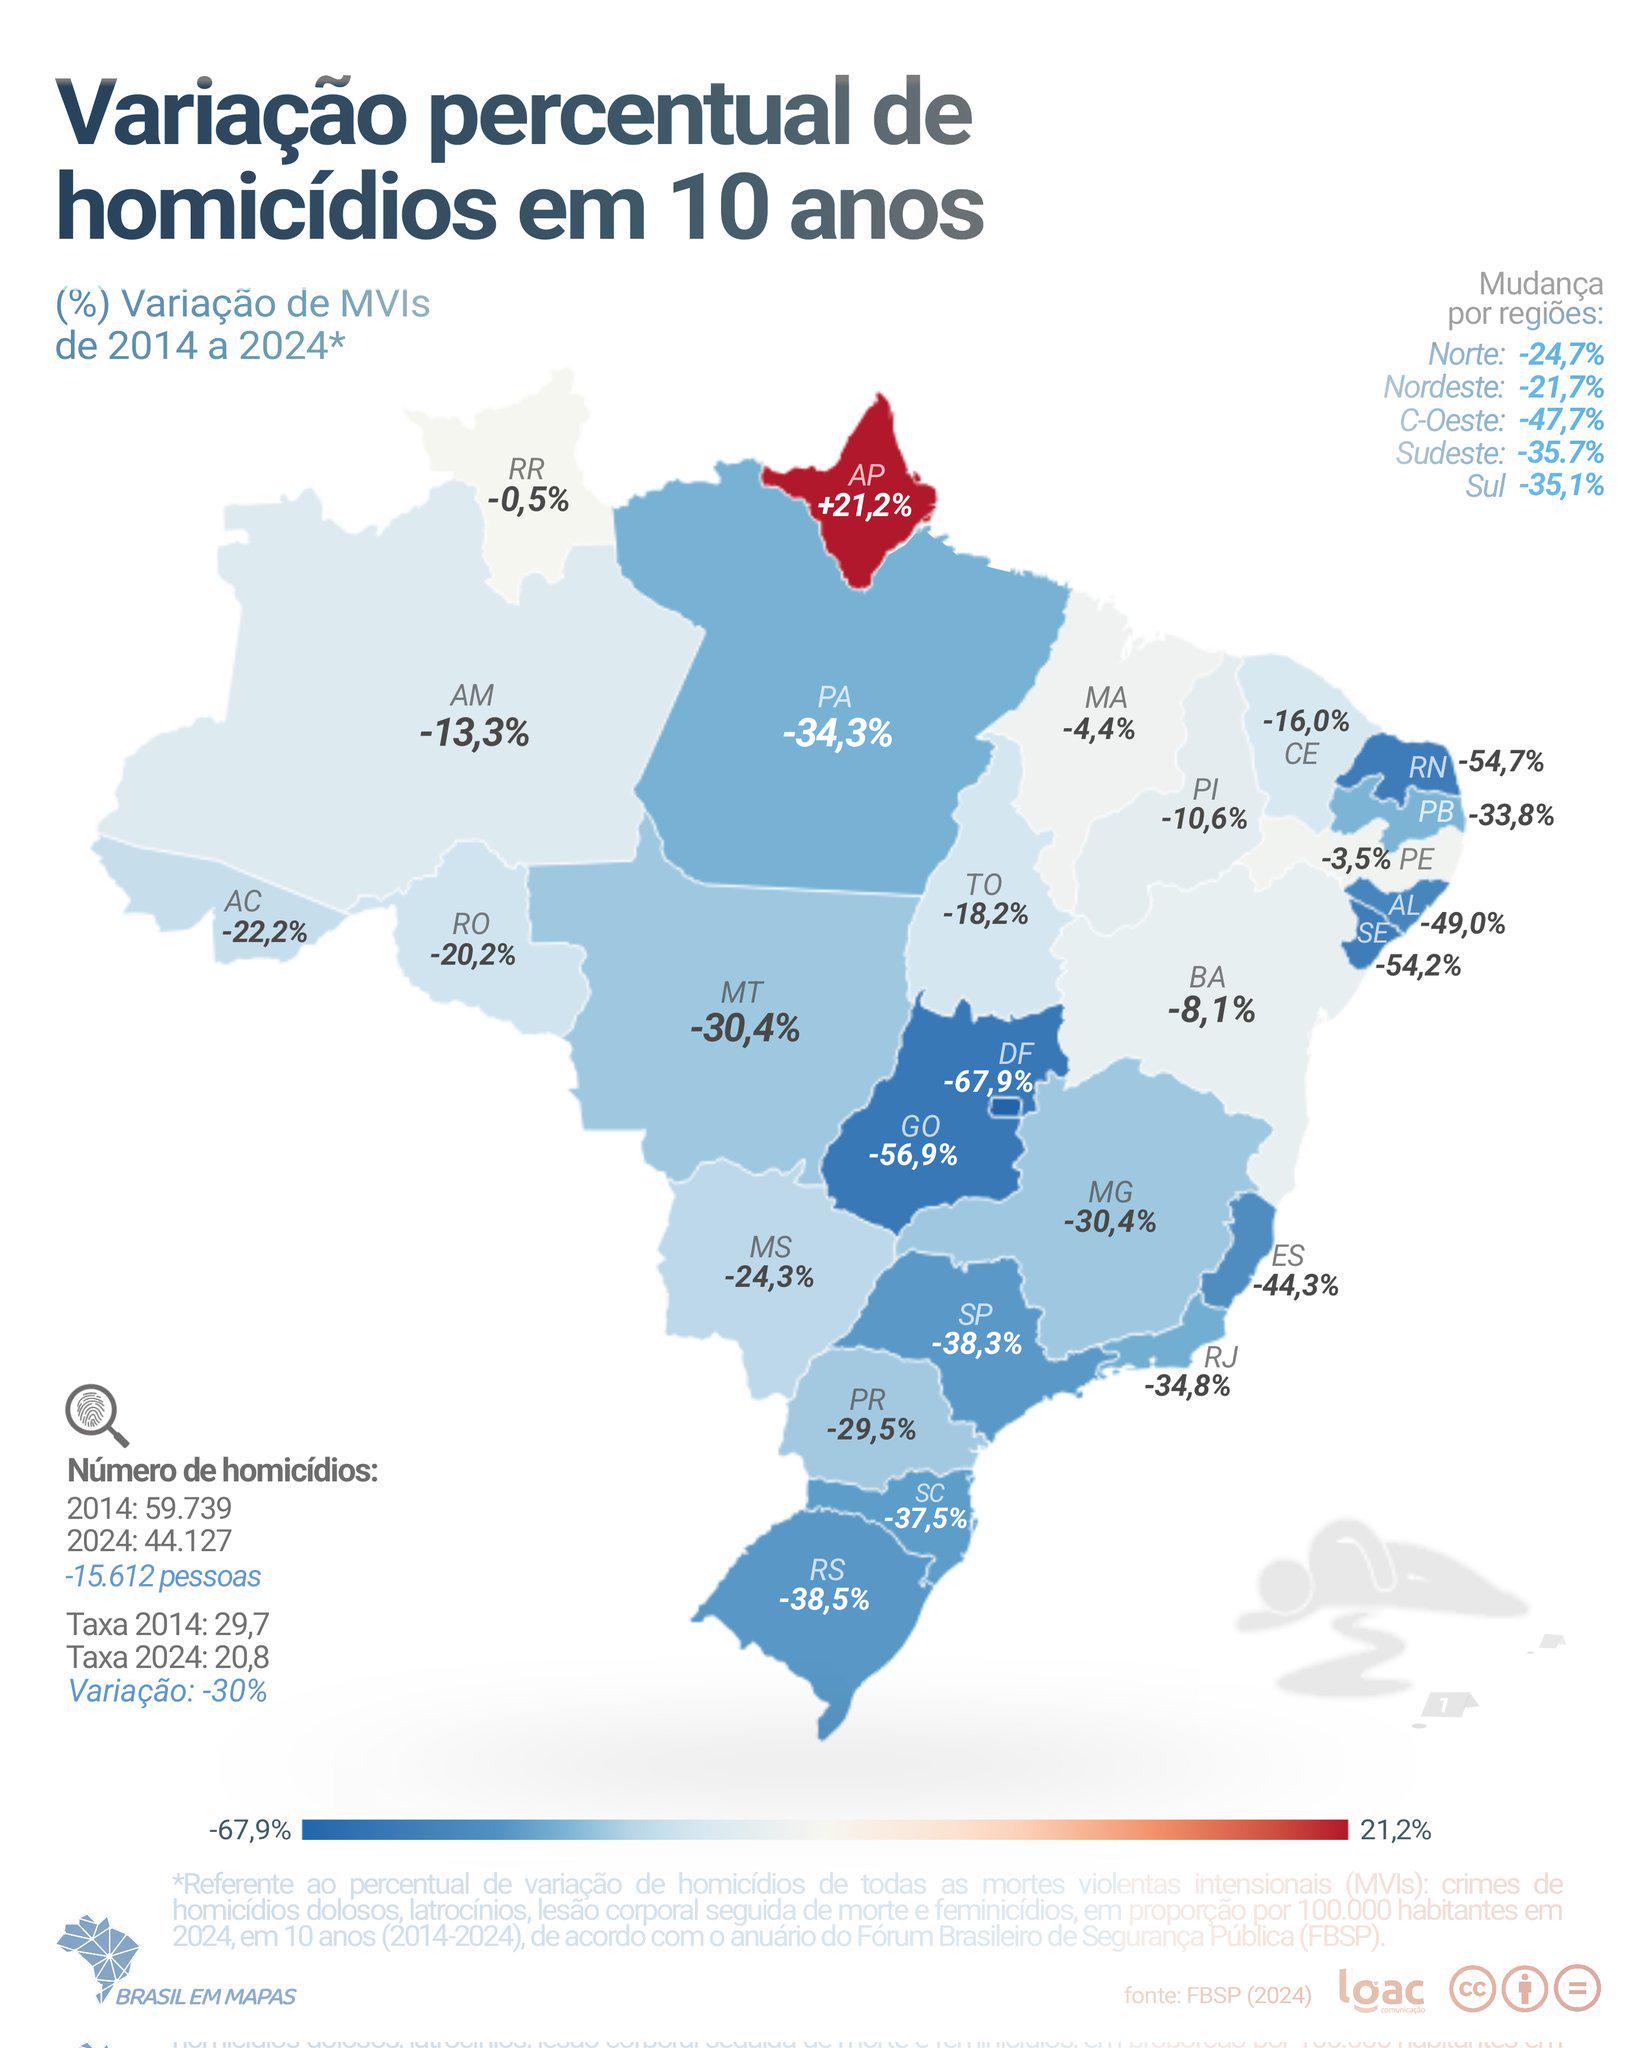
Homicide Rates in Brazil Map 2014 vs 2025
The visualization titled "Annual Homicide Rates in Brazil: 2014 vs 2025" offers a stark comparison of homicide rates acr...
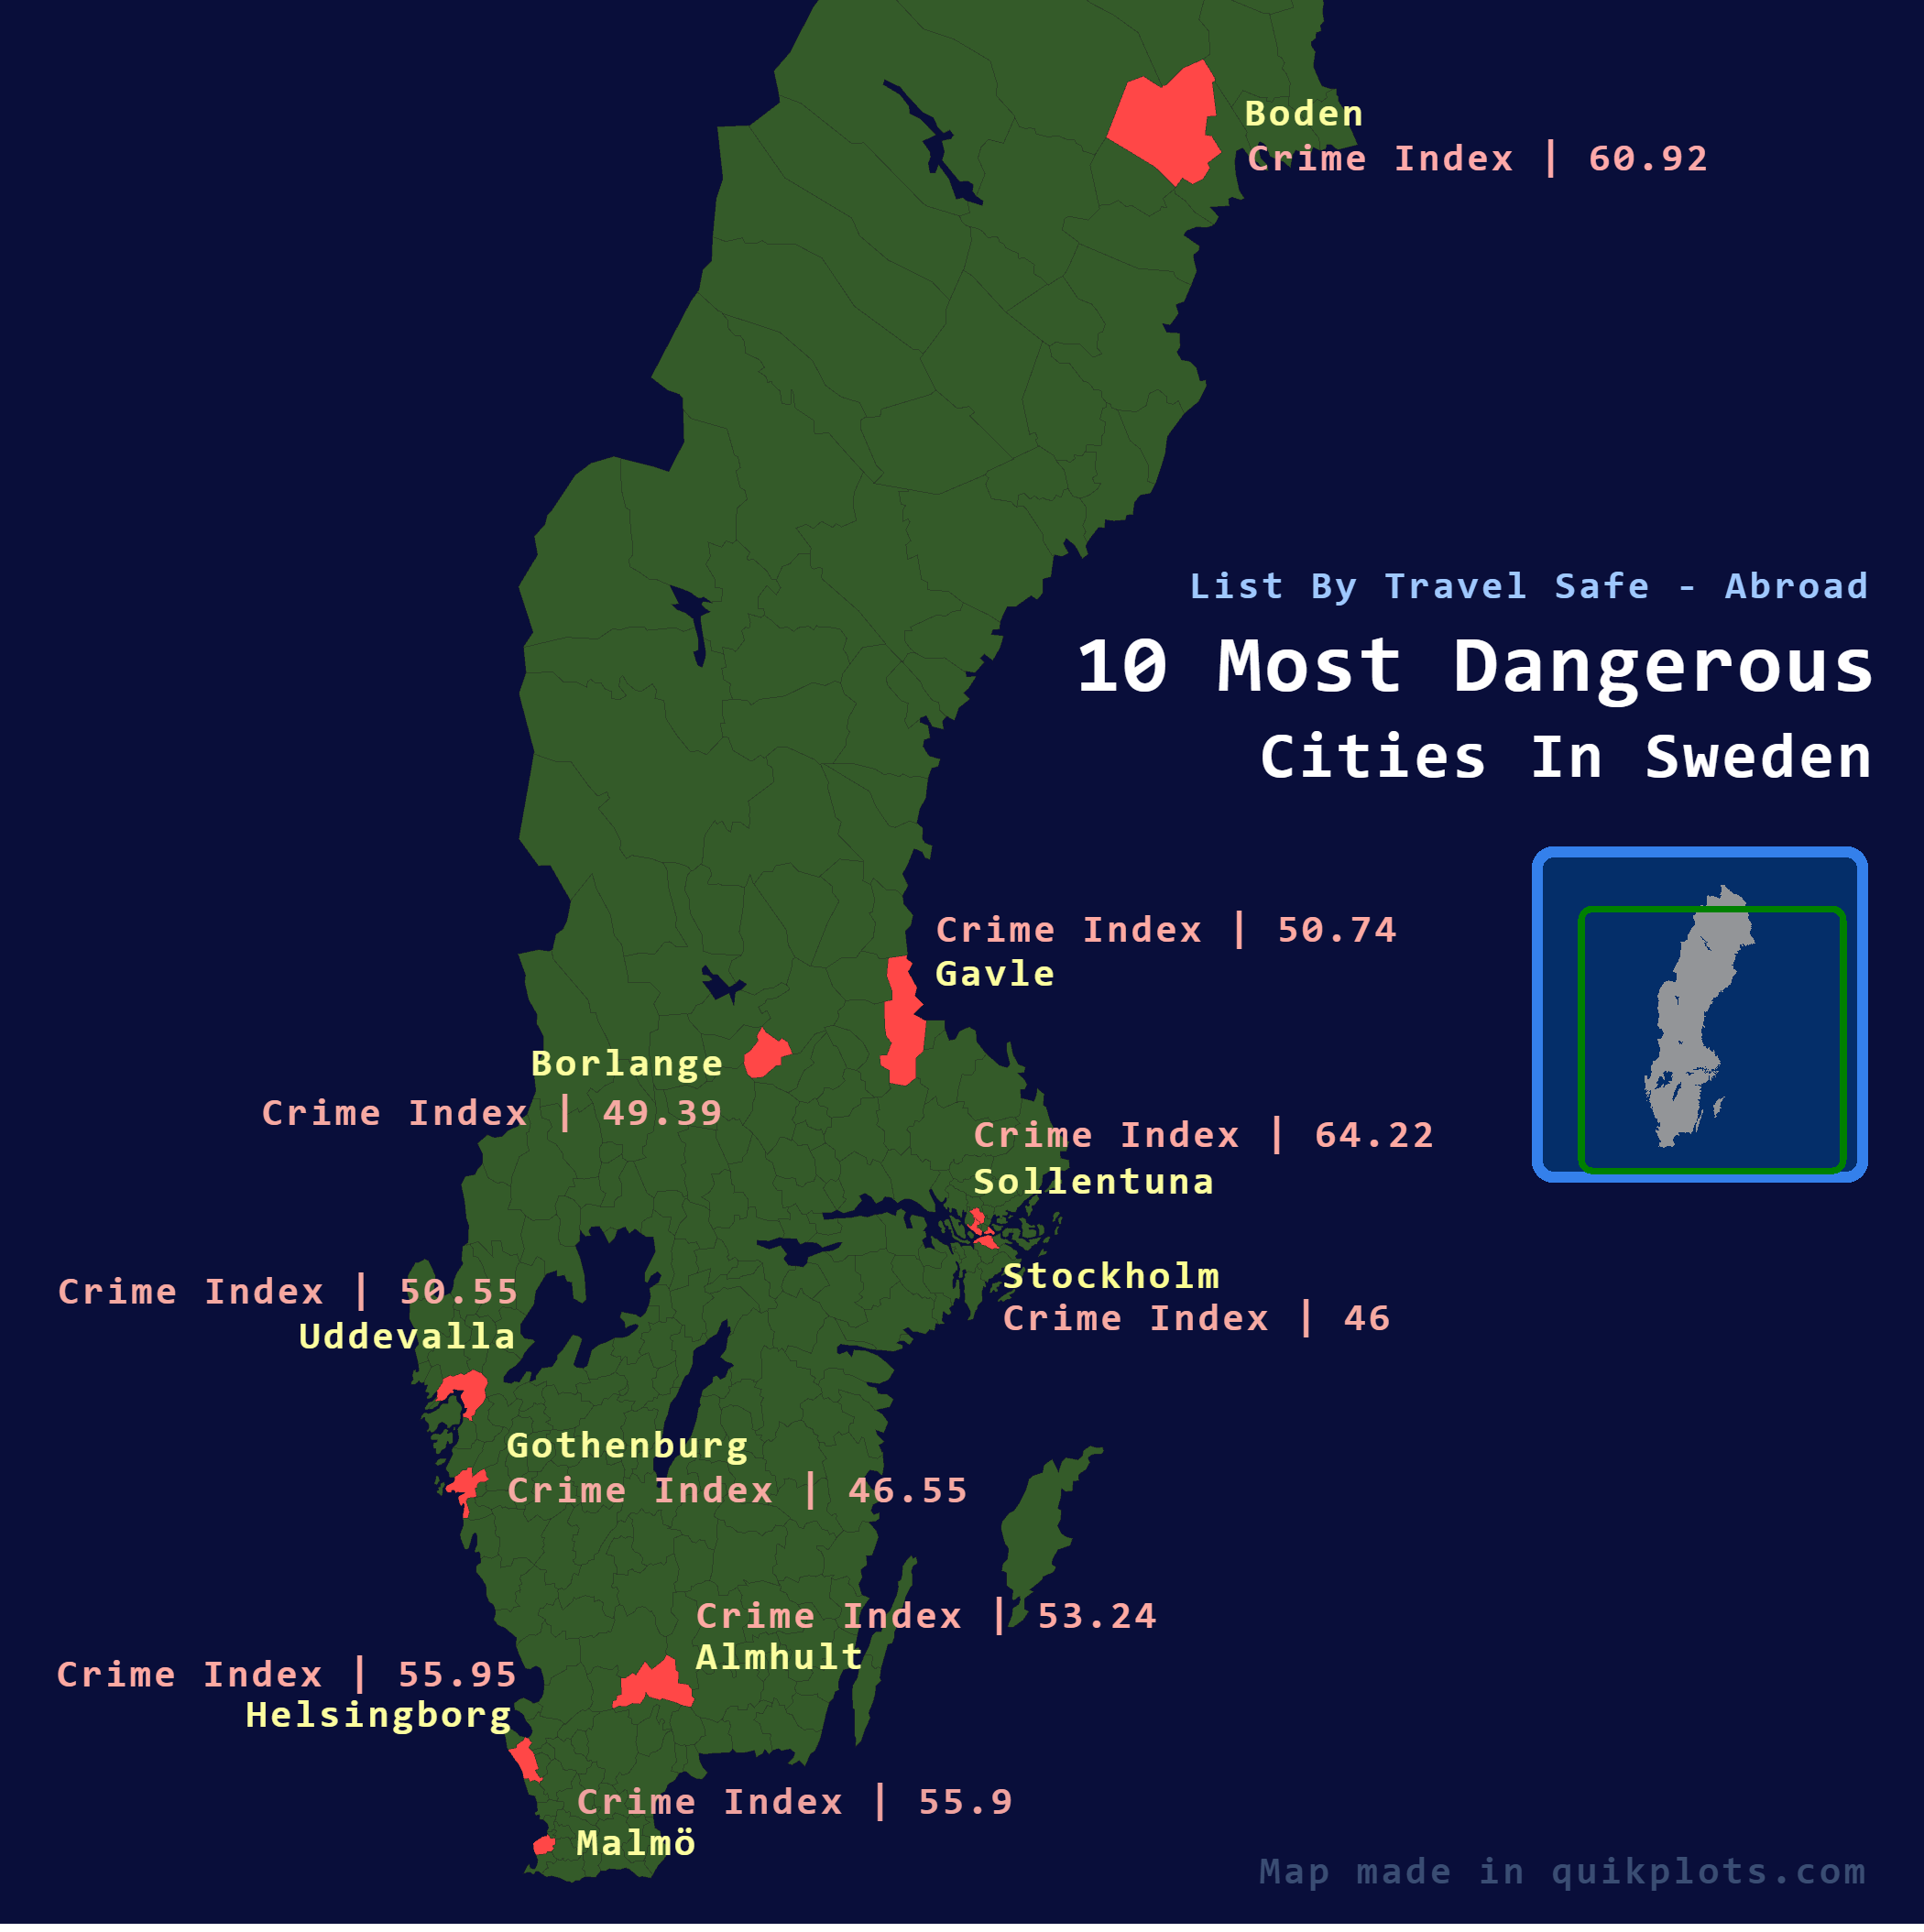
10 Most Dangerous Cities in Sweden Map
The map titled "10 Most Dangerous Cities in Sweden" provides a visual representation of urban safety across Sweden, high...
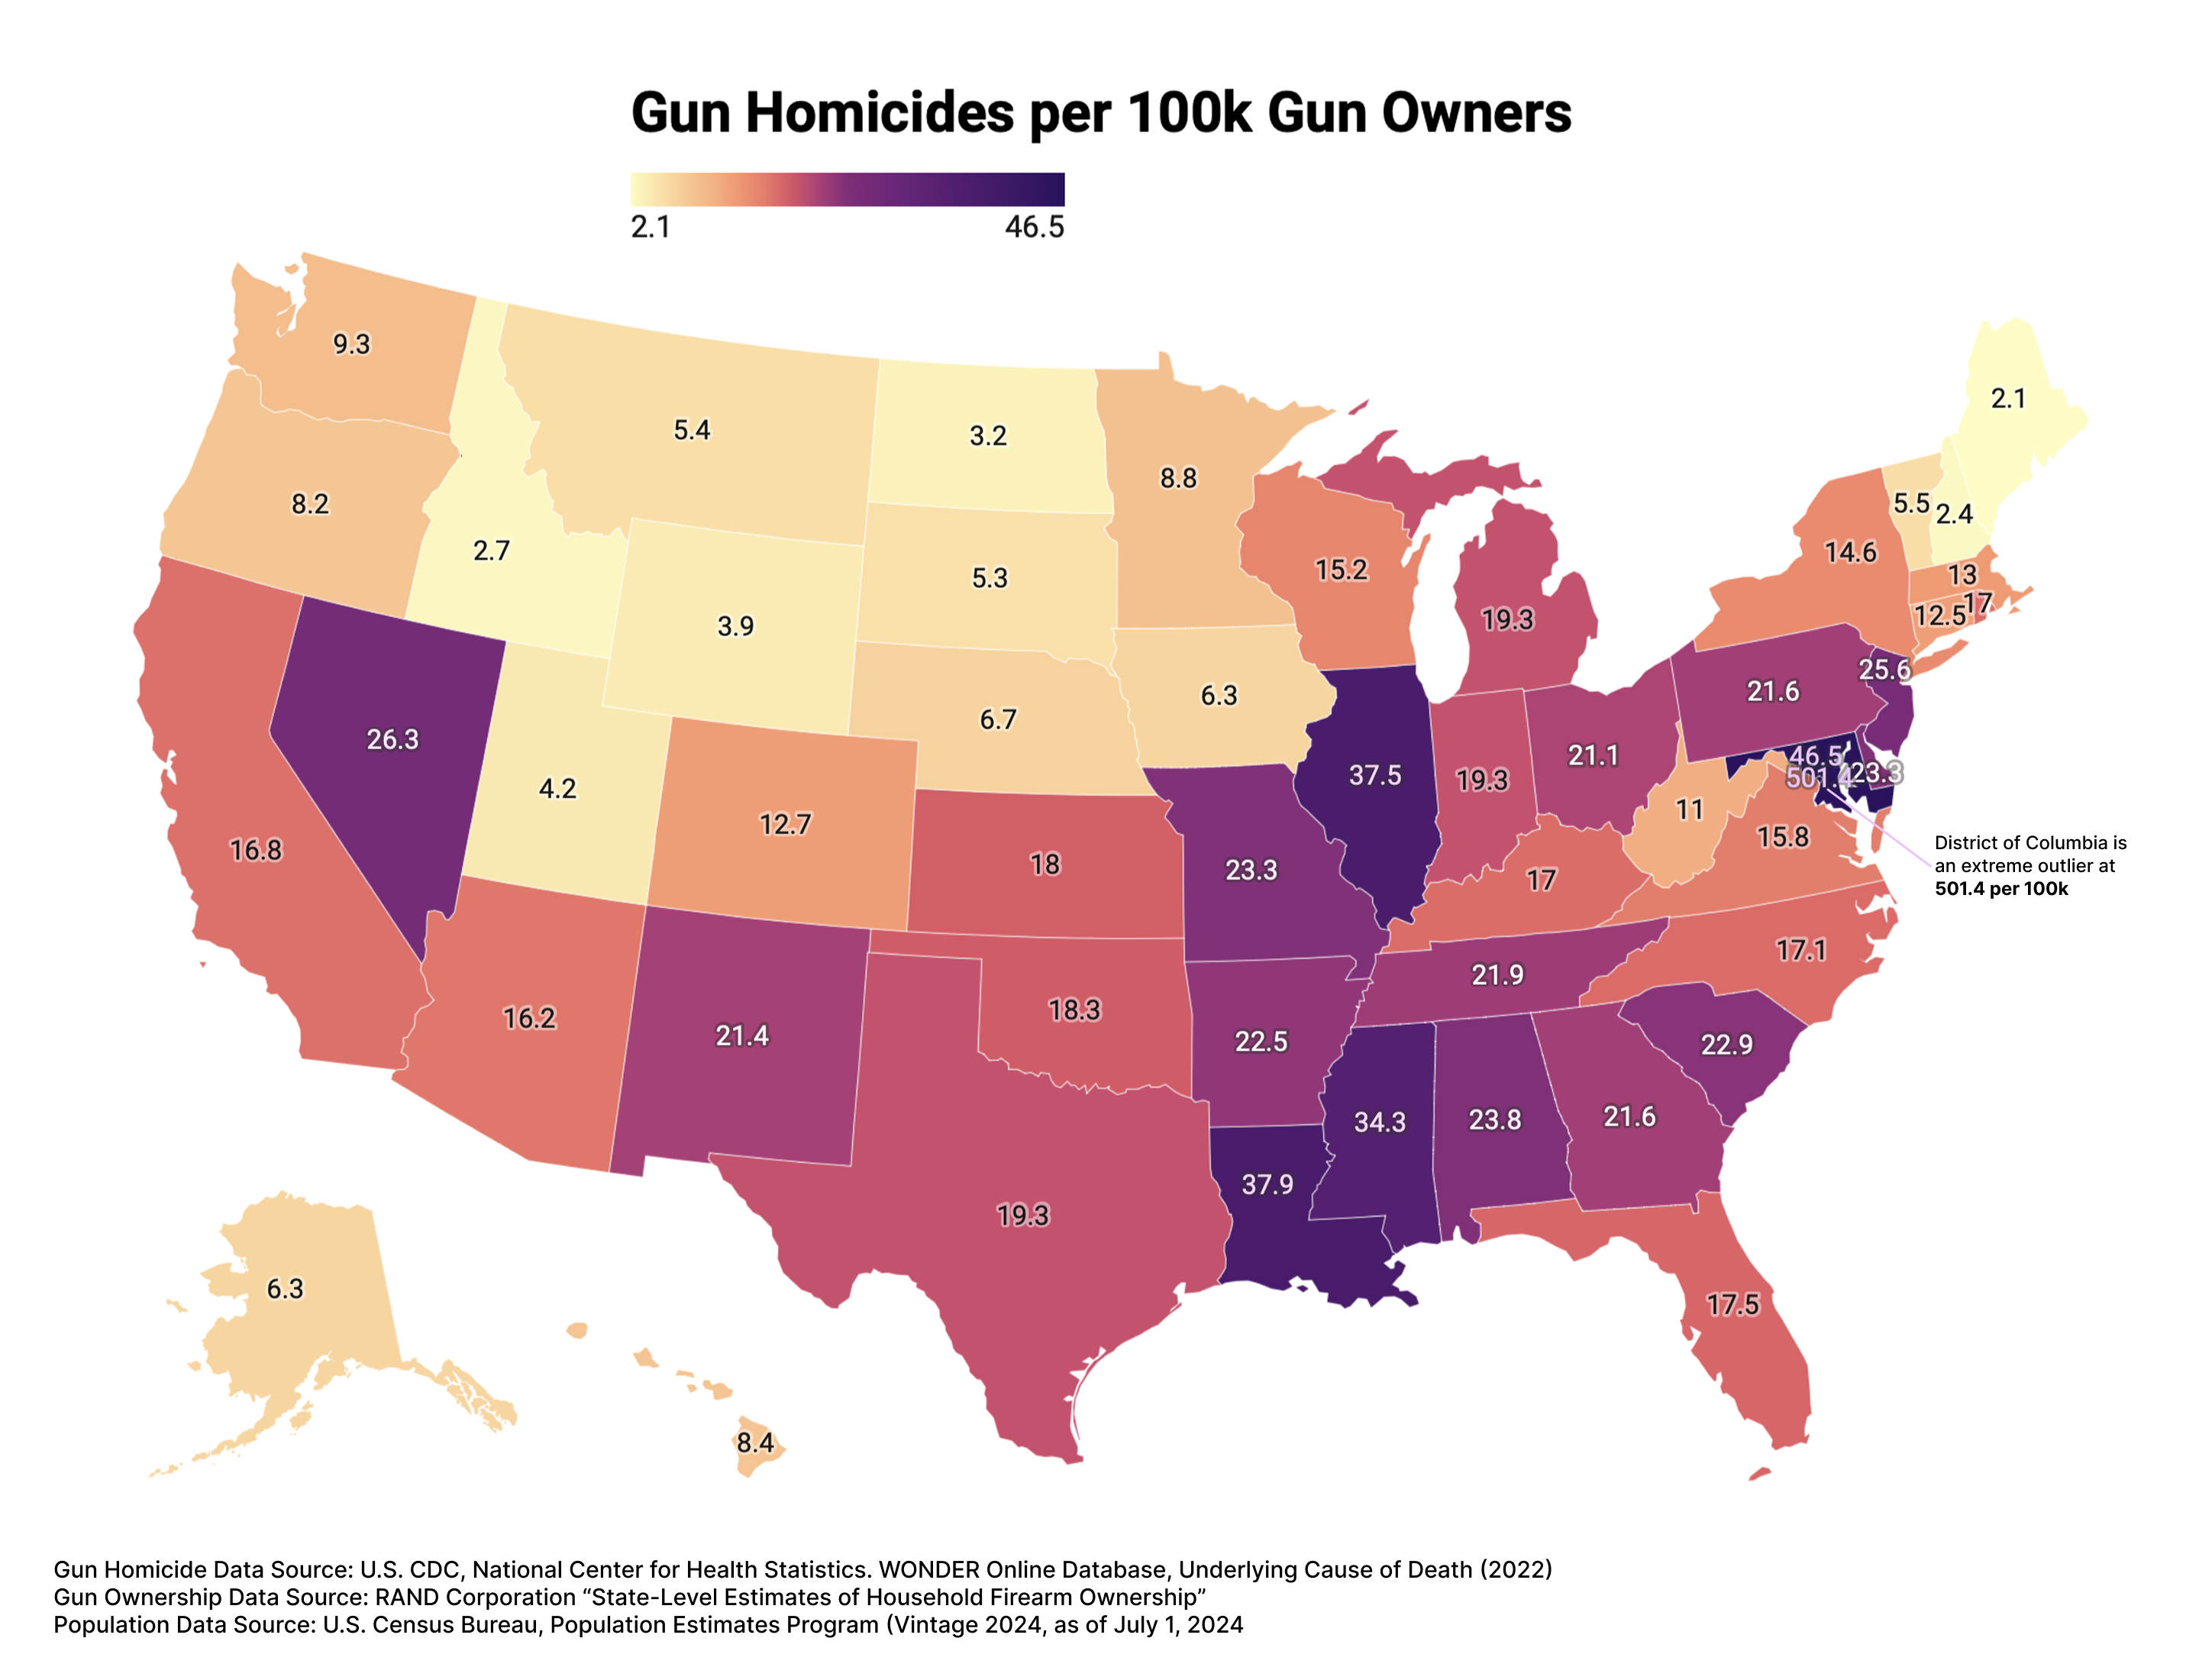
Gun Homicides per 100k Gun Owners Map
The "Gun Homicides per 100k Gun Owners" map provides a stark visualization of gun-related homicides across various regio...
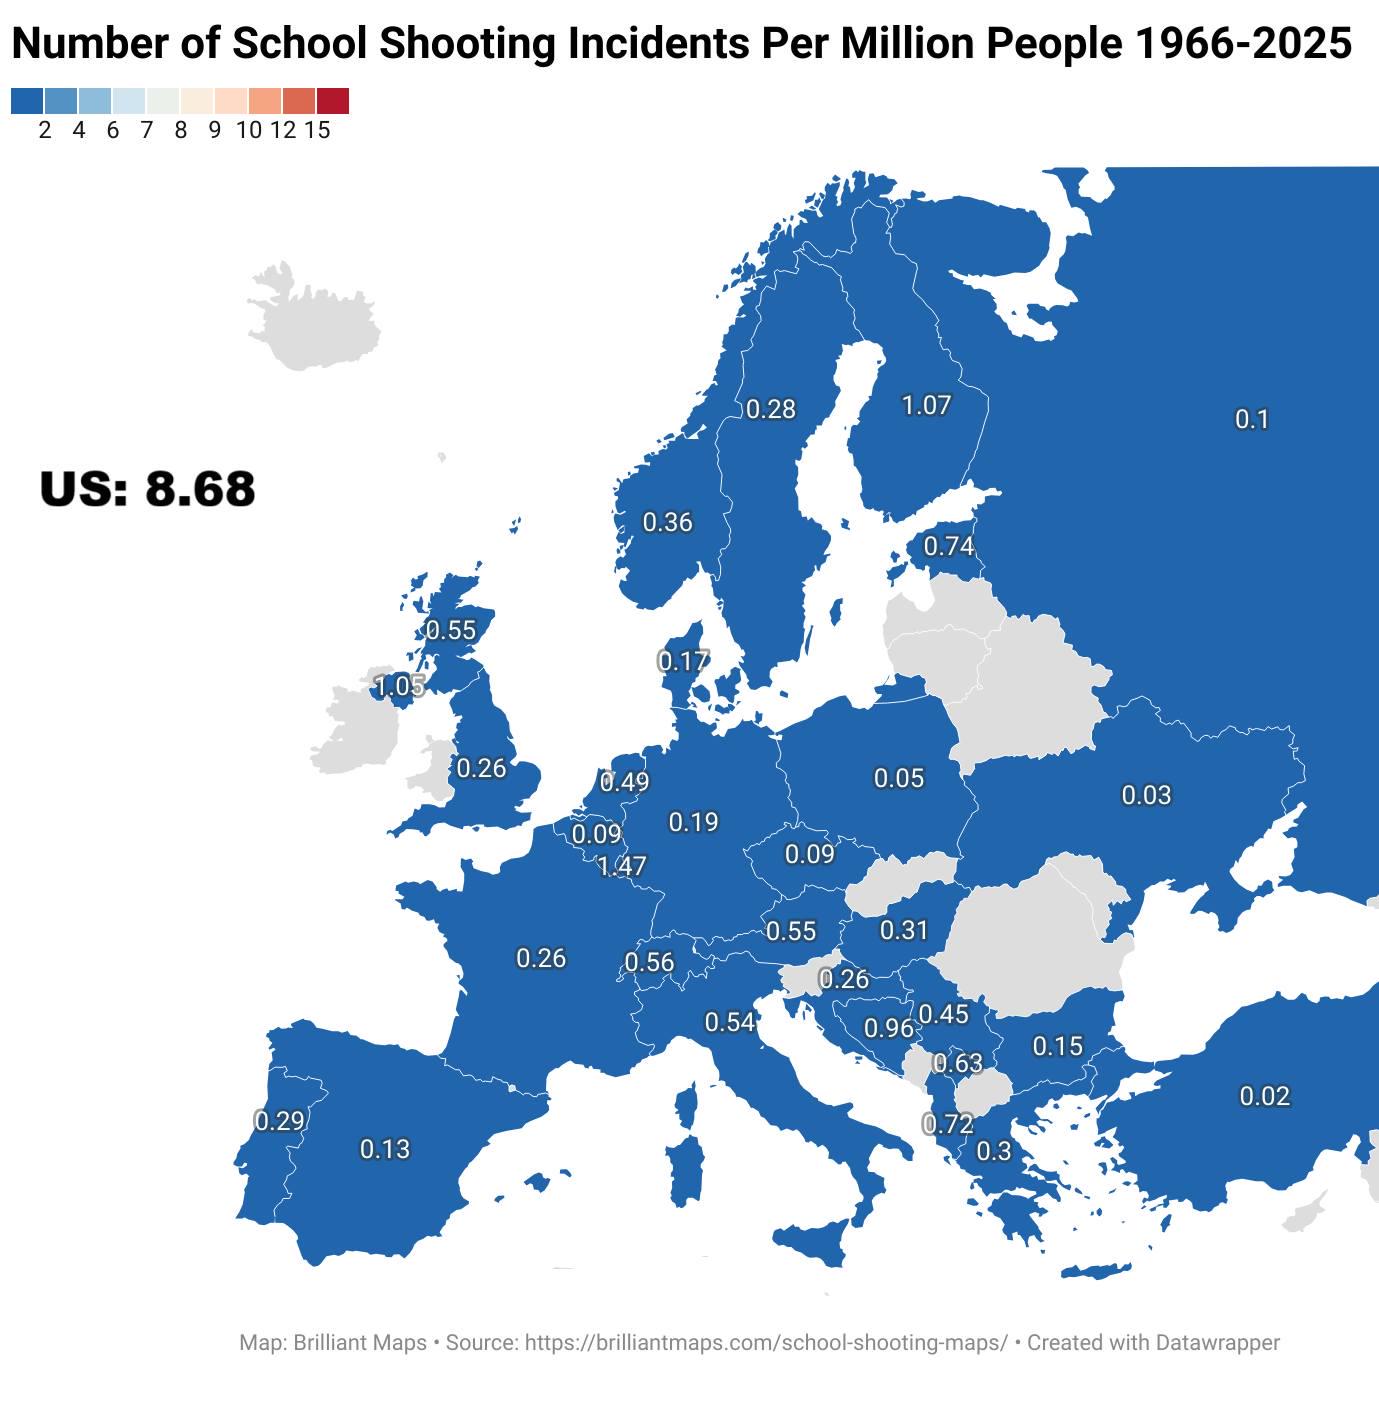
School Shootings Per Million People Map in Europe
The map titled "Number of School Shootings Per Million People By European Country Between 1966 and 2025" provides a star...