employment statistics Maps
4 geographic visualizations tagged with "employment statistics"

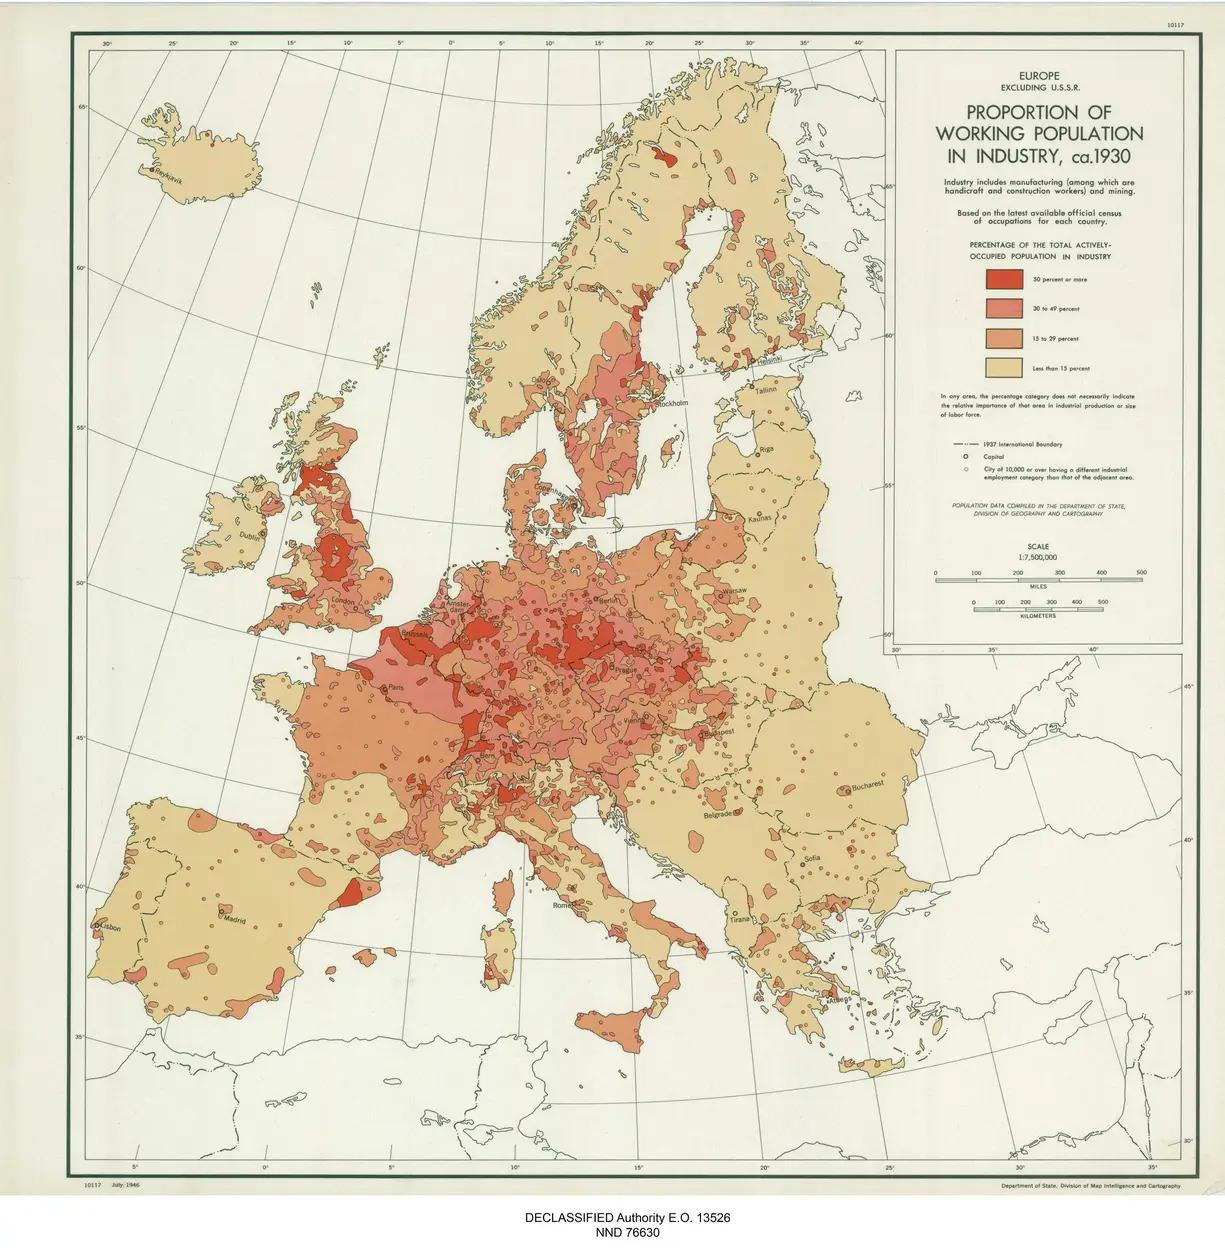
Map of Working Population in Industry in 1930s Europe
The map titled "Proportion of the Working Population Working in Industry in Europe in the 1930s" offers a fascinating gl...
👁 50📅 9/19/2025

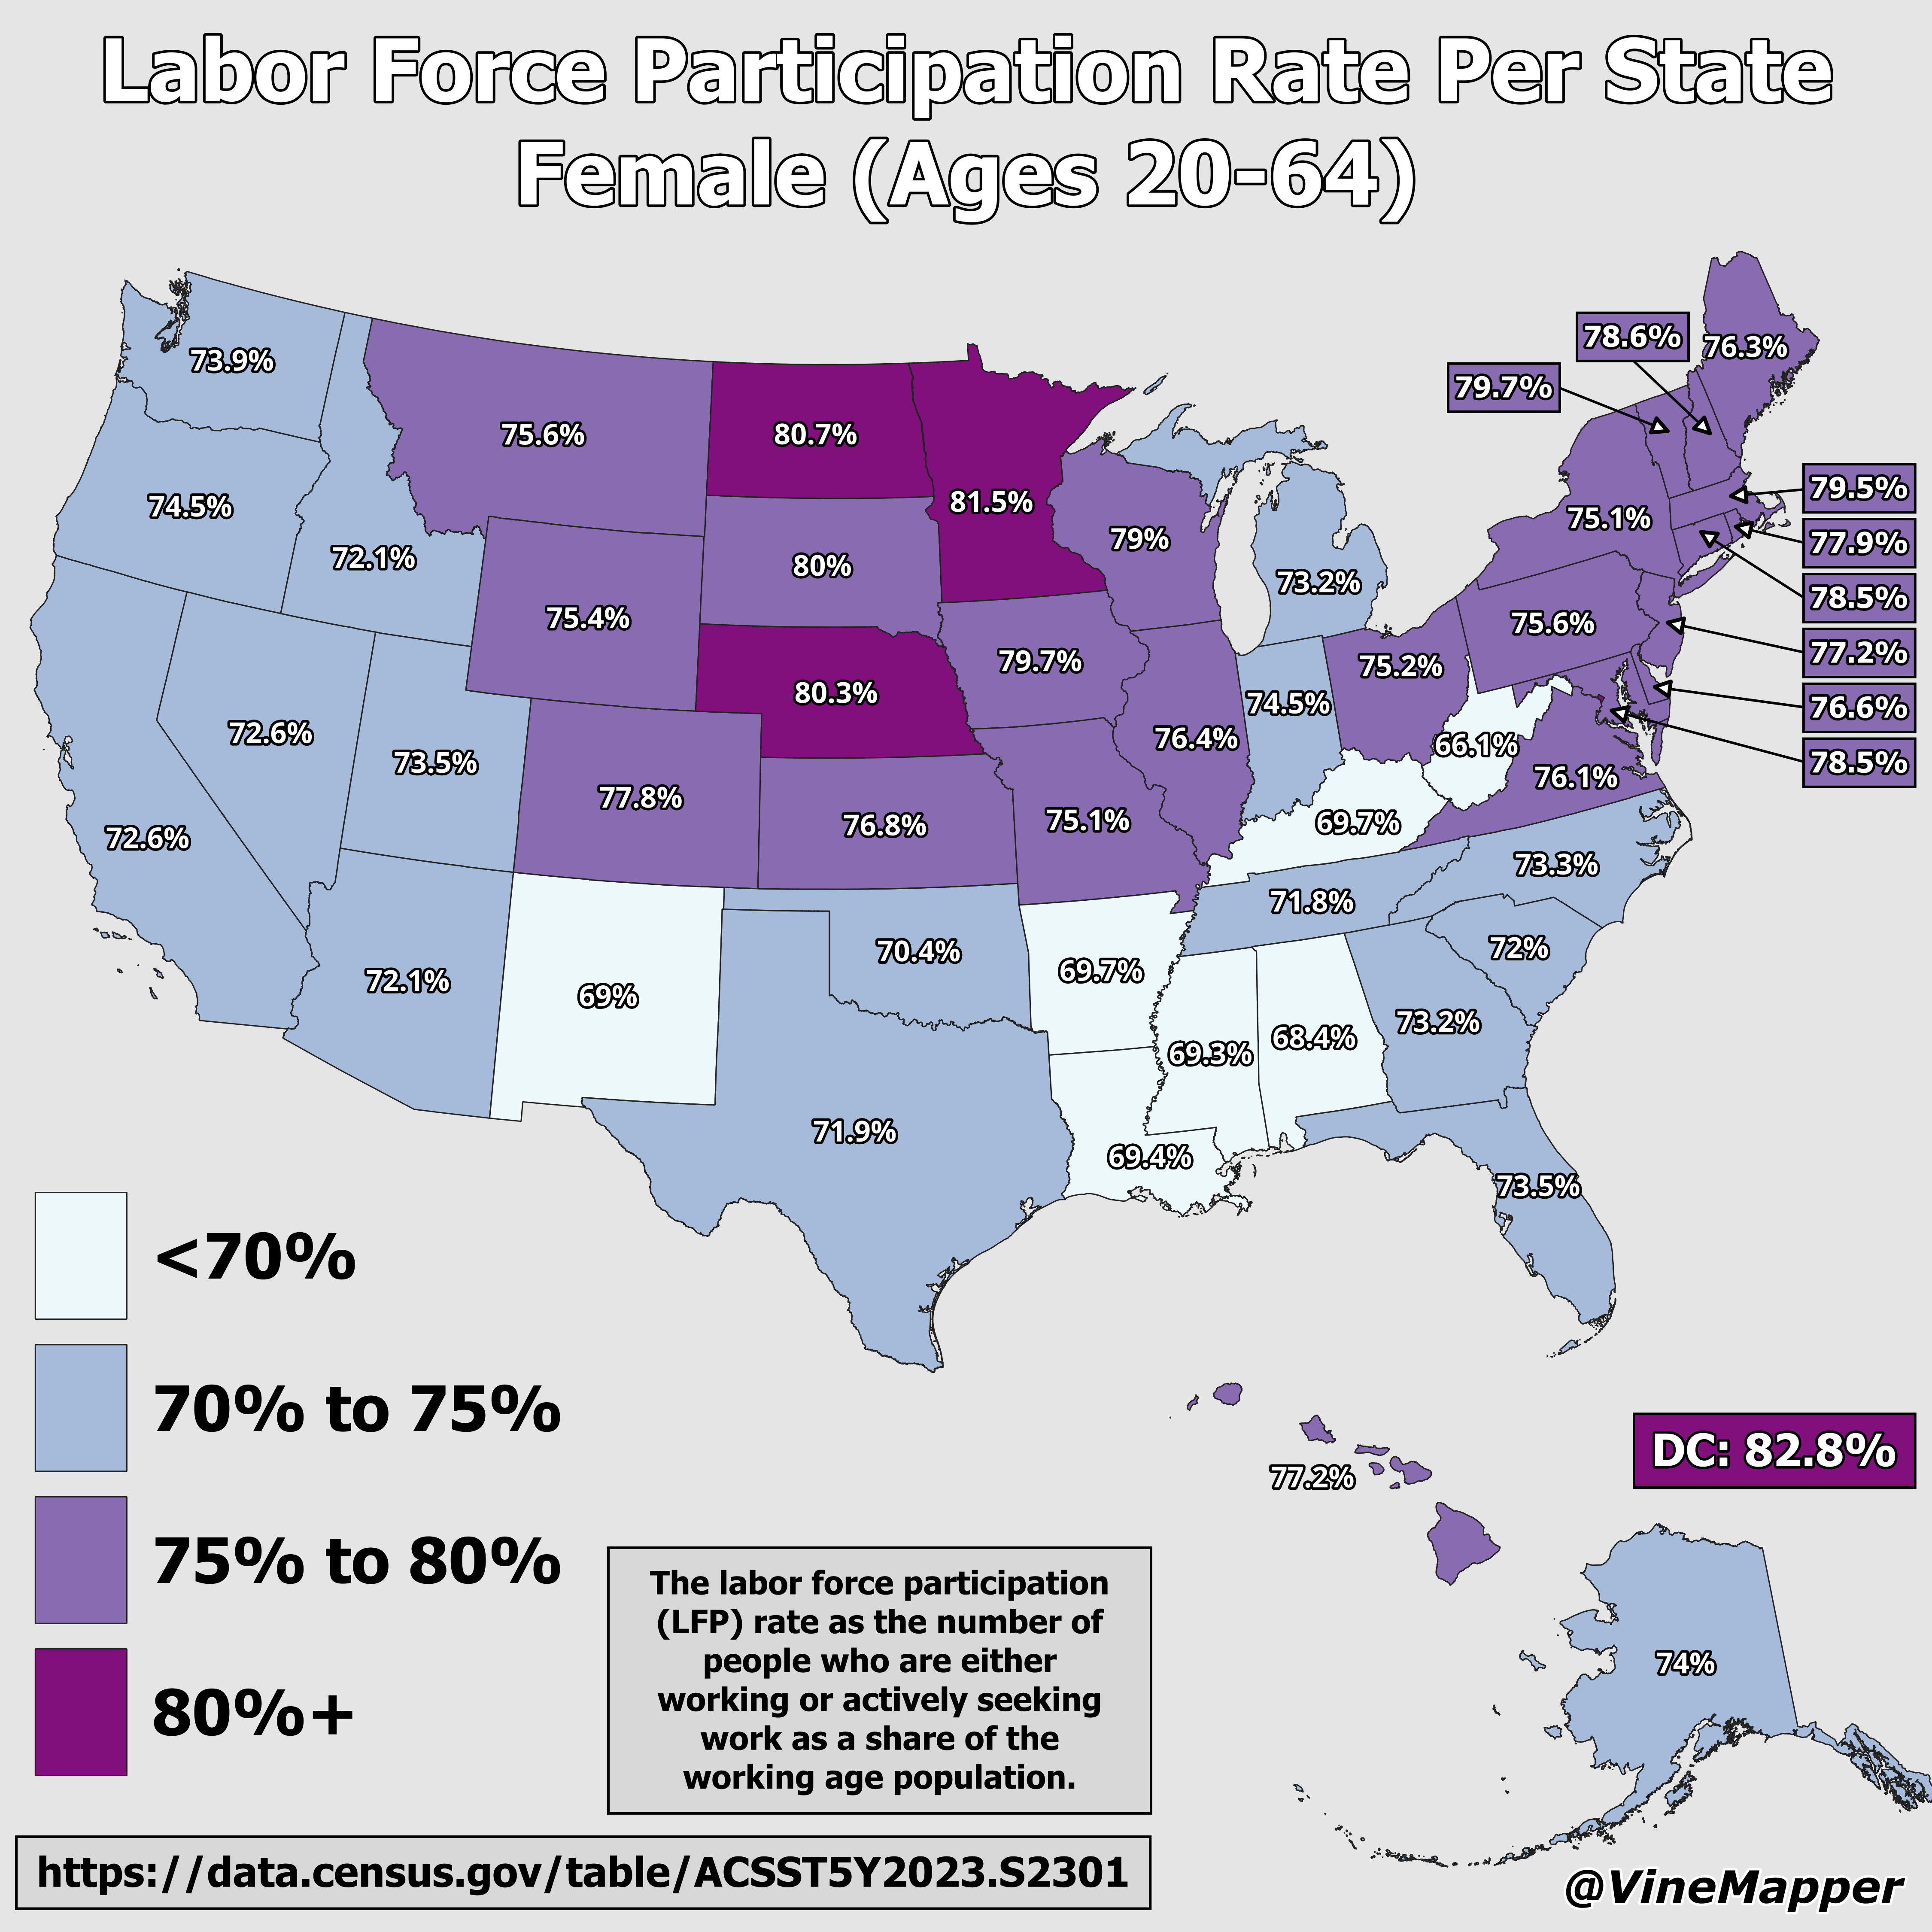
Labor Force Participation Rate Female Ages 20-64 Map
The "Labor Force Participation Rate Per State, Female (Ages 20-64) Map" presents a visual representation of the percenta...
👁 58📅 9/12/2025

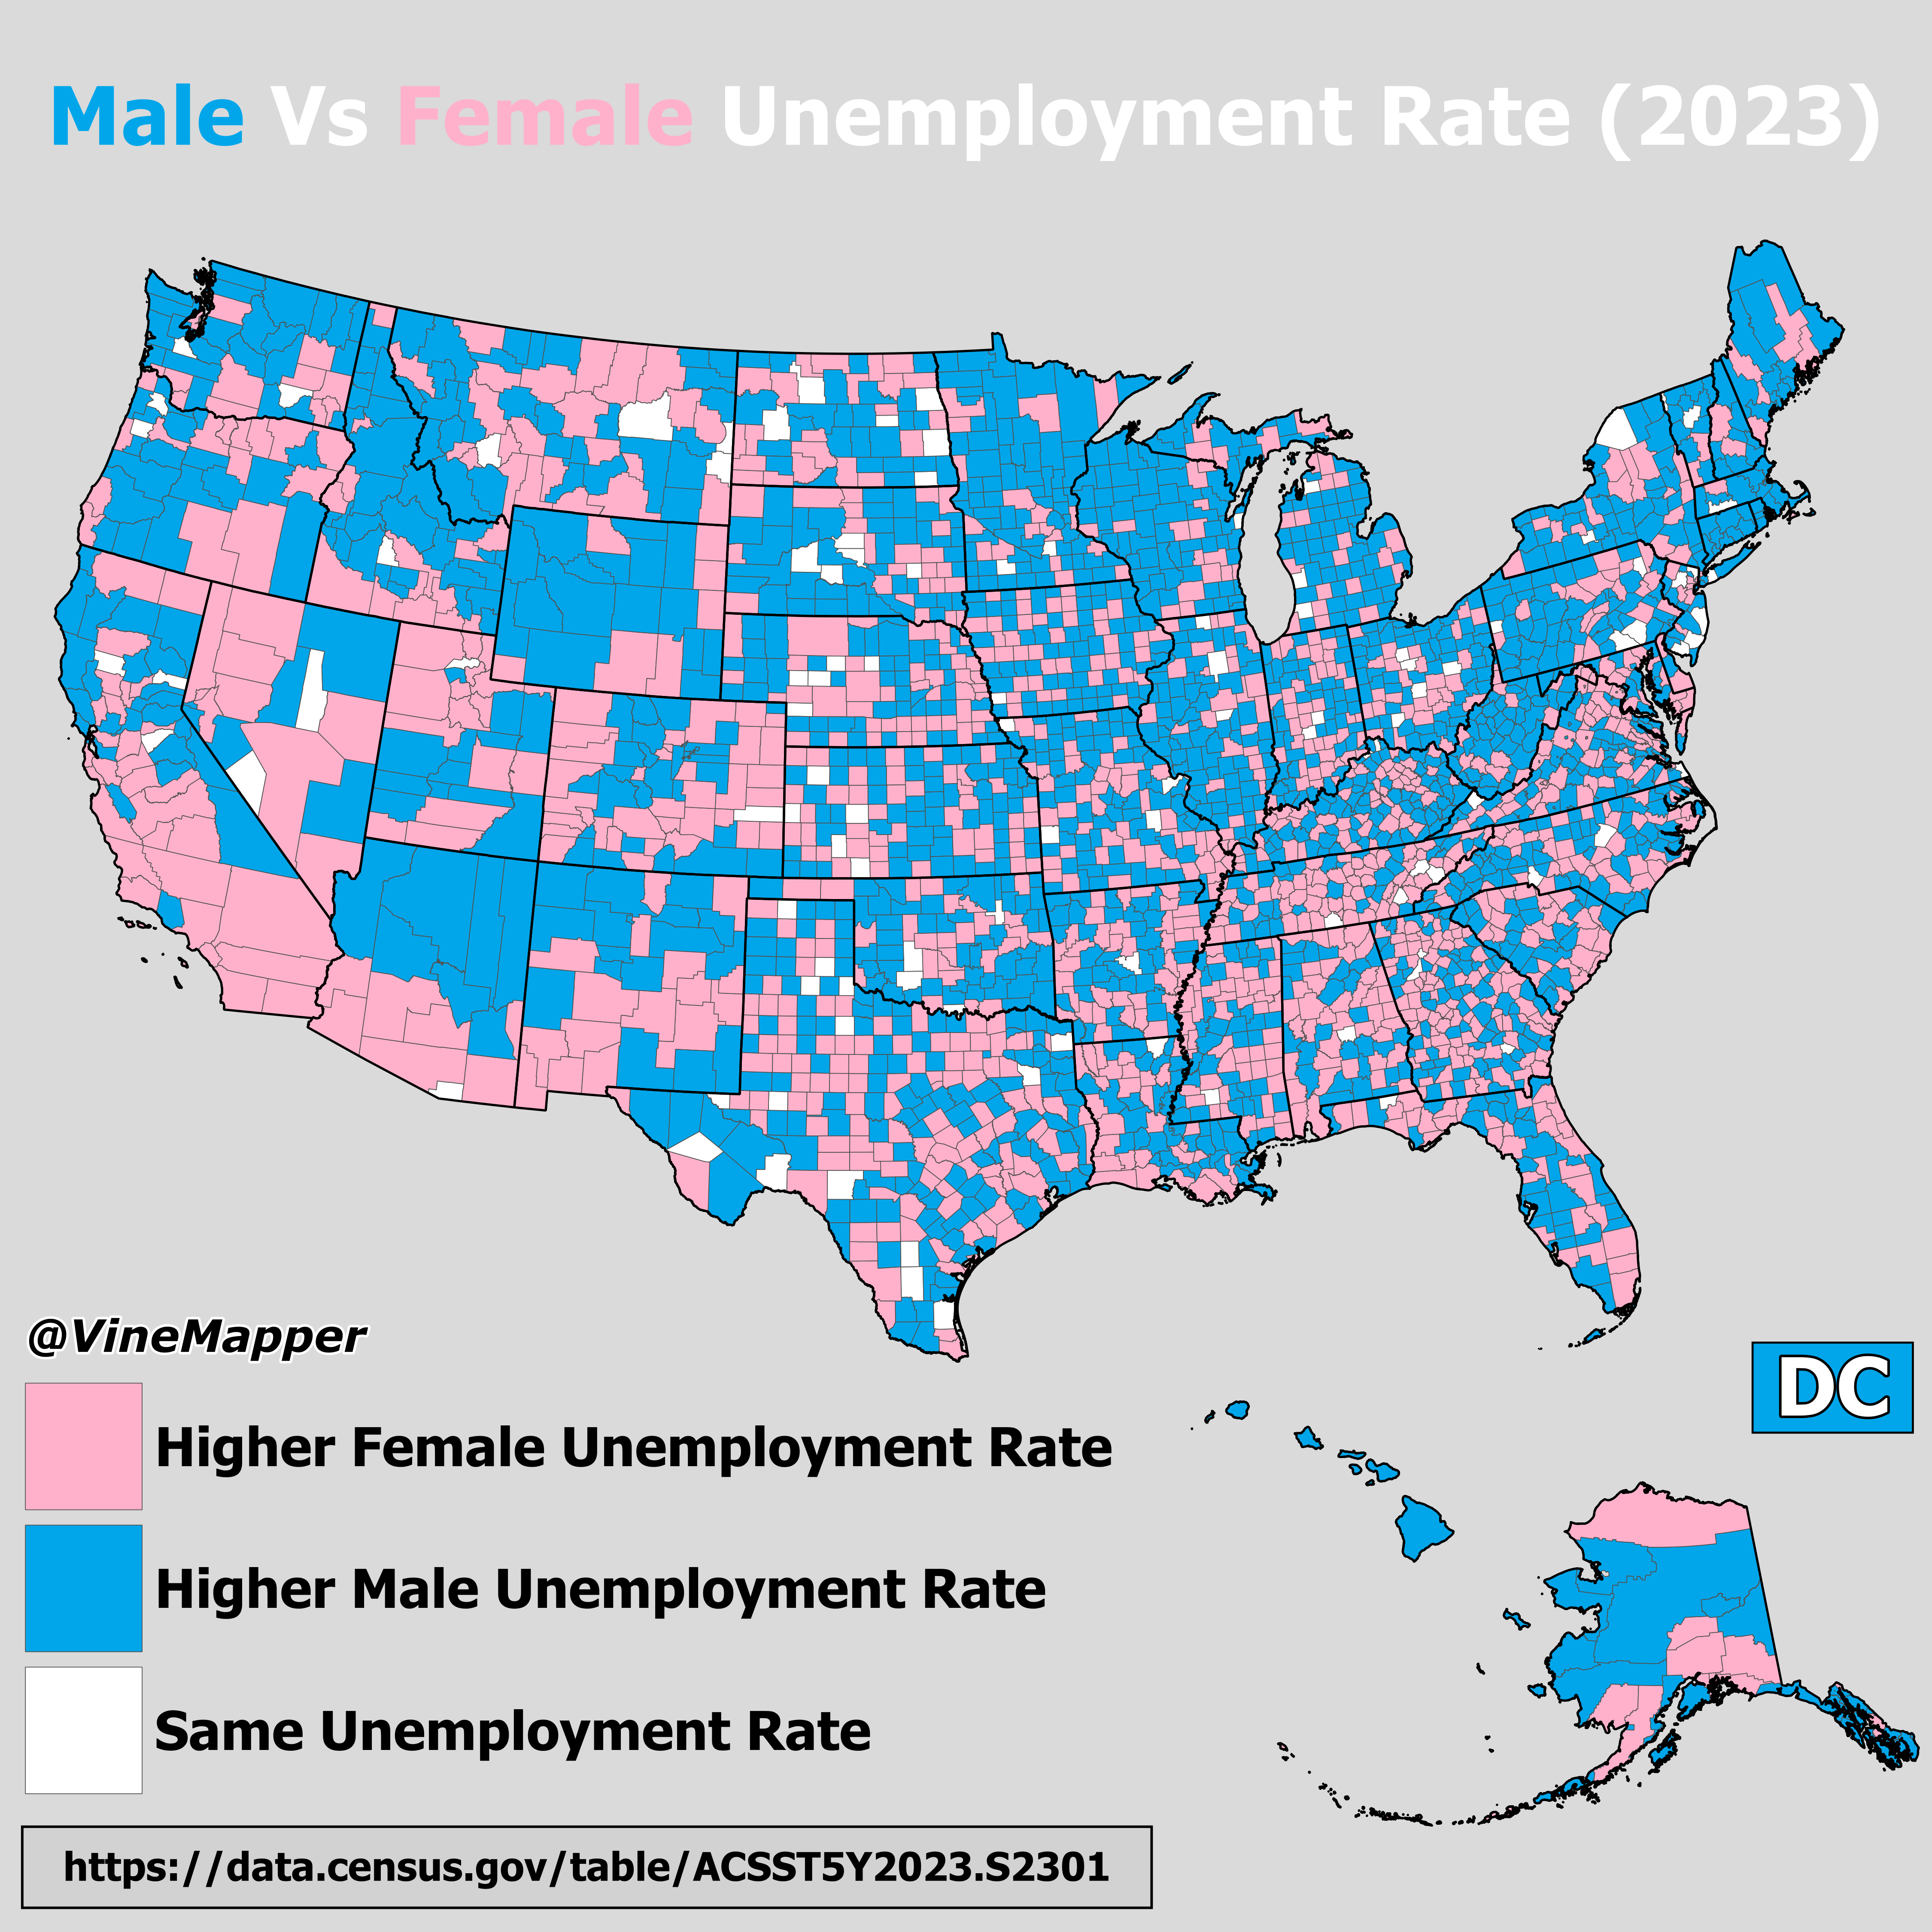
Male Vs Female Unemployment Rate Per County Map
The "Male Vs Female Unemployment Rate Per County (2023)" map provides a clear and informative snapshot of unemployment d...
👁 82📅 8/21/2025

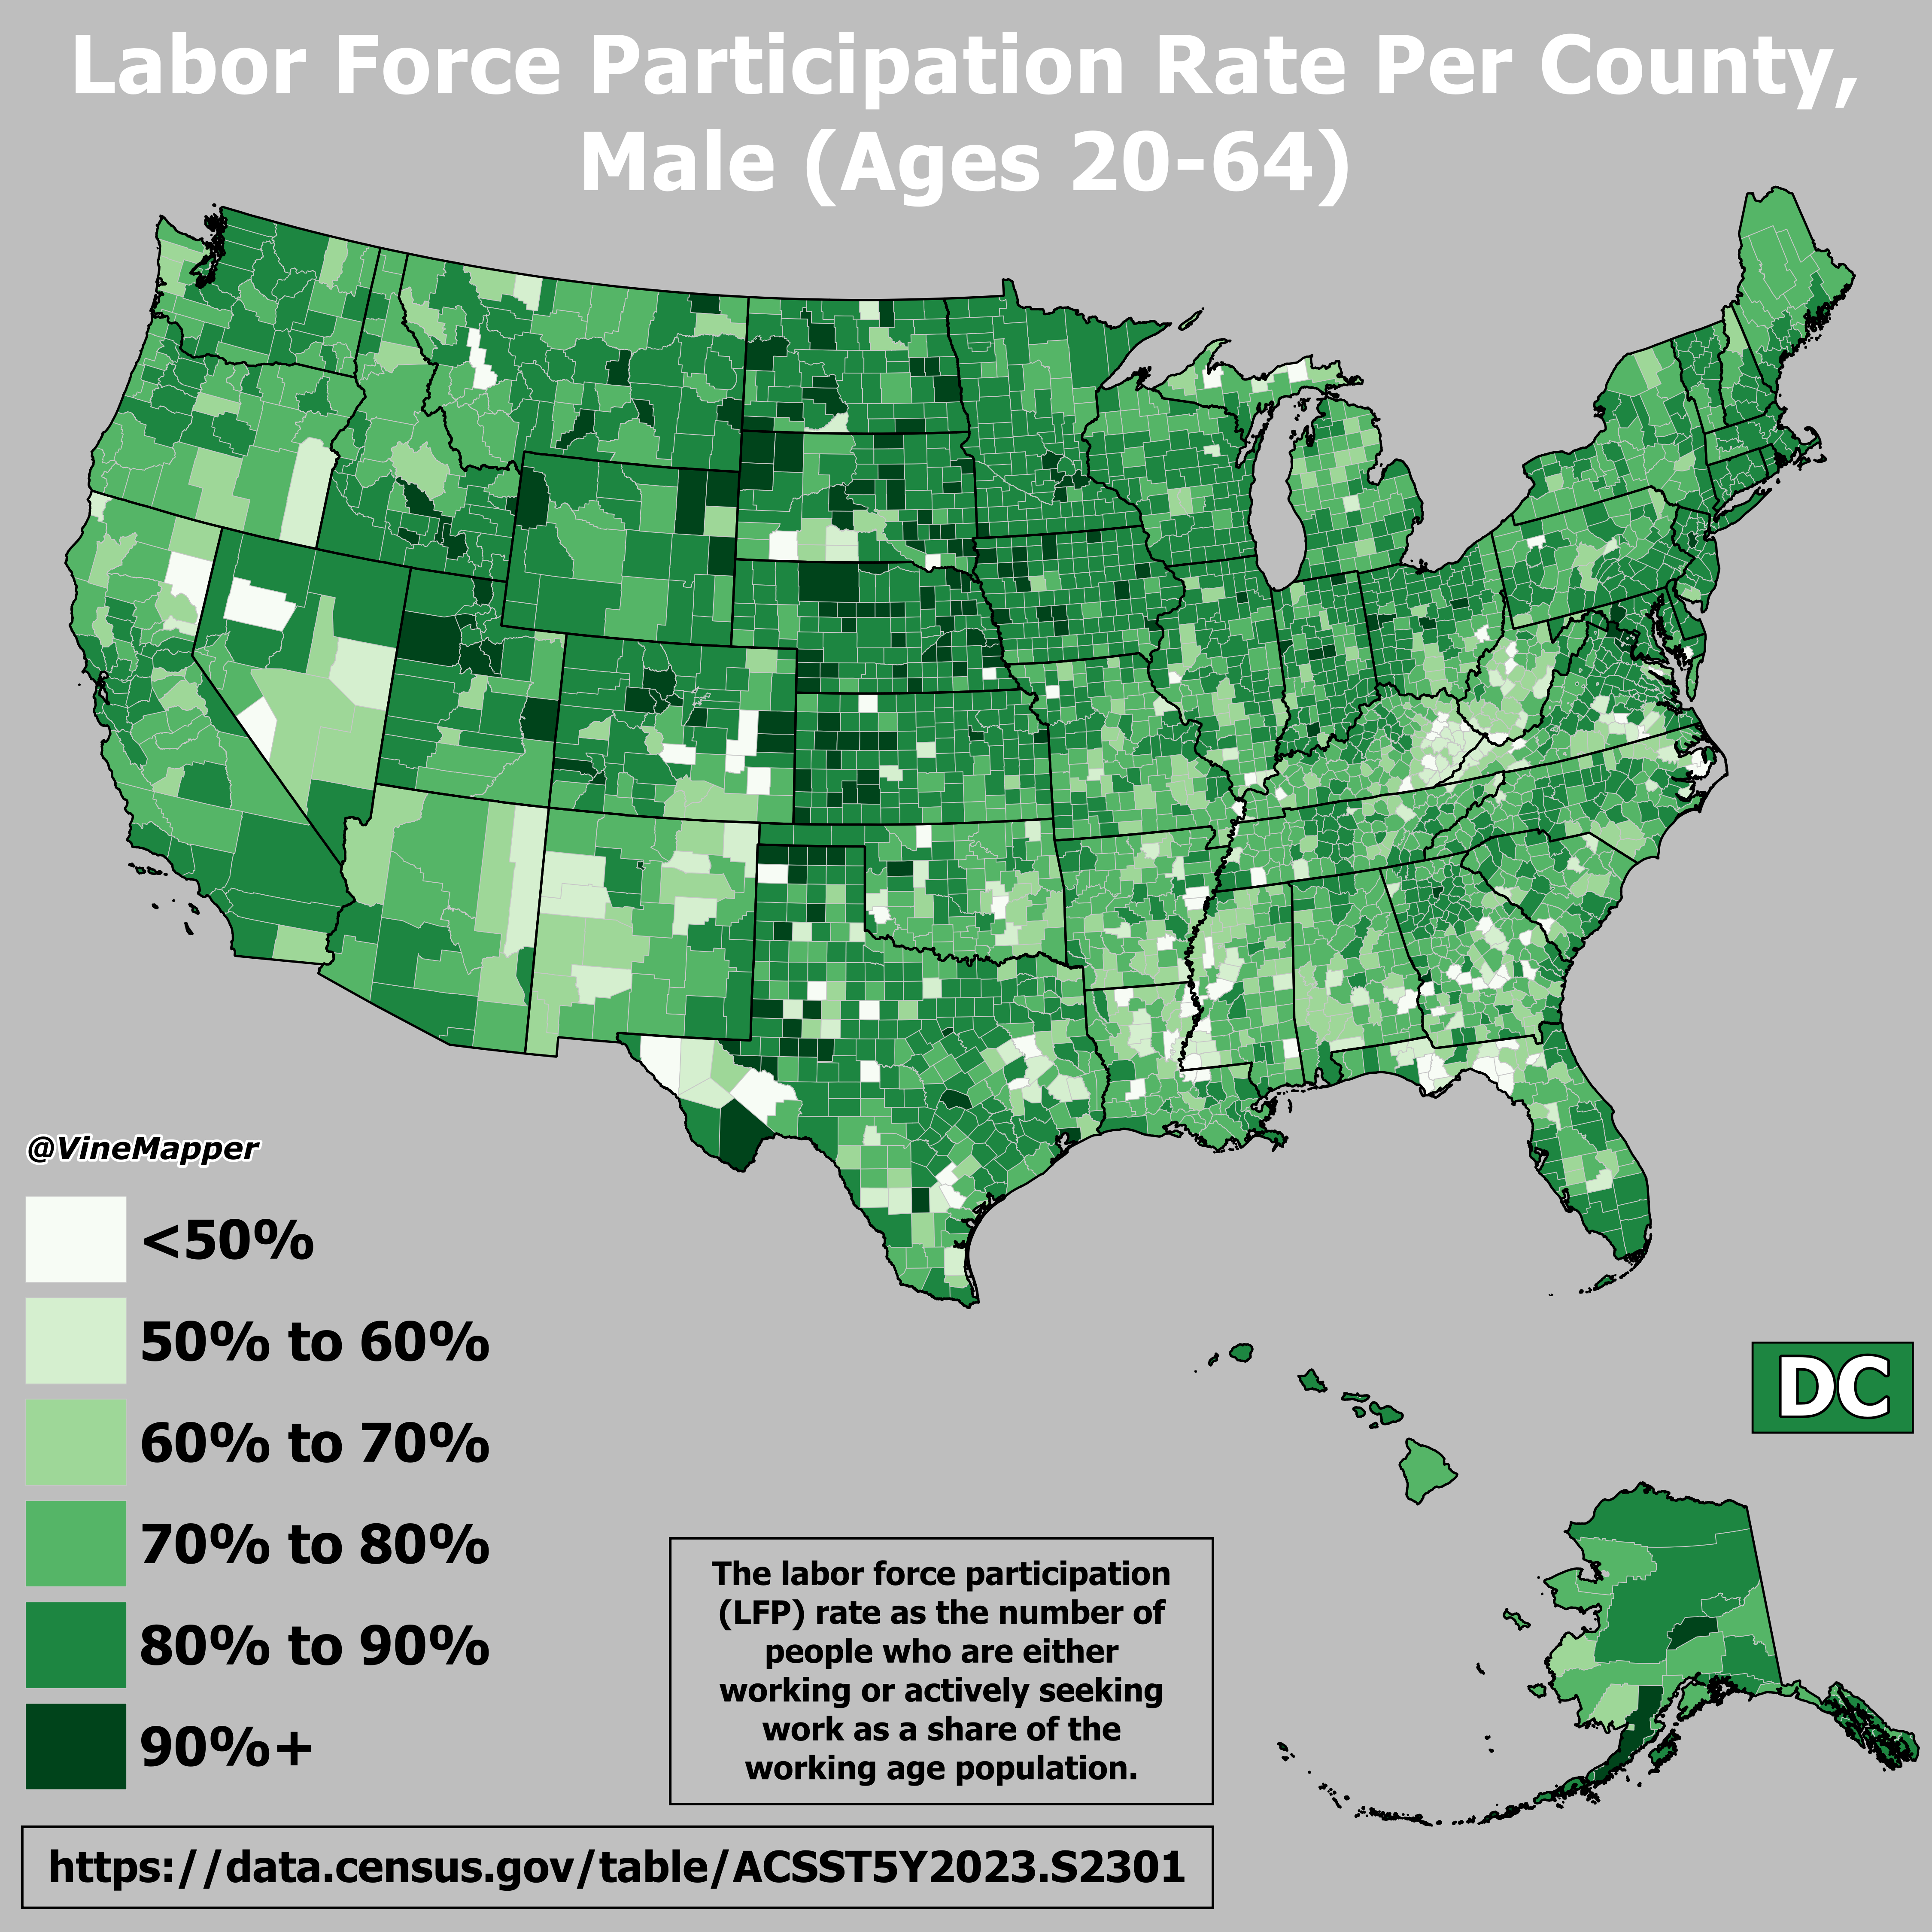
Labor Force Participation Rate Map for Males Ages 20-64
This map visualizes the labor force participation rate of males aged 20 to 64 across the United States. It highlights th...
👁 56📅 8/29/2025