Black Student Test Scores by US State Map

Alex Cartwright
Senior Cartographer & GIS Specialist
Alex Cartwright is a renowned cartographer and geographic information systems specialist with over 15 years of experience in spatial analysis and data...
Geographic Analysis
What This Map Shows
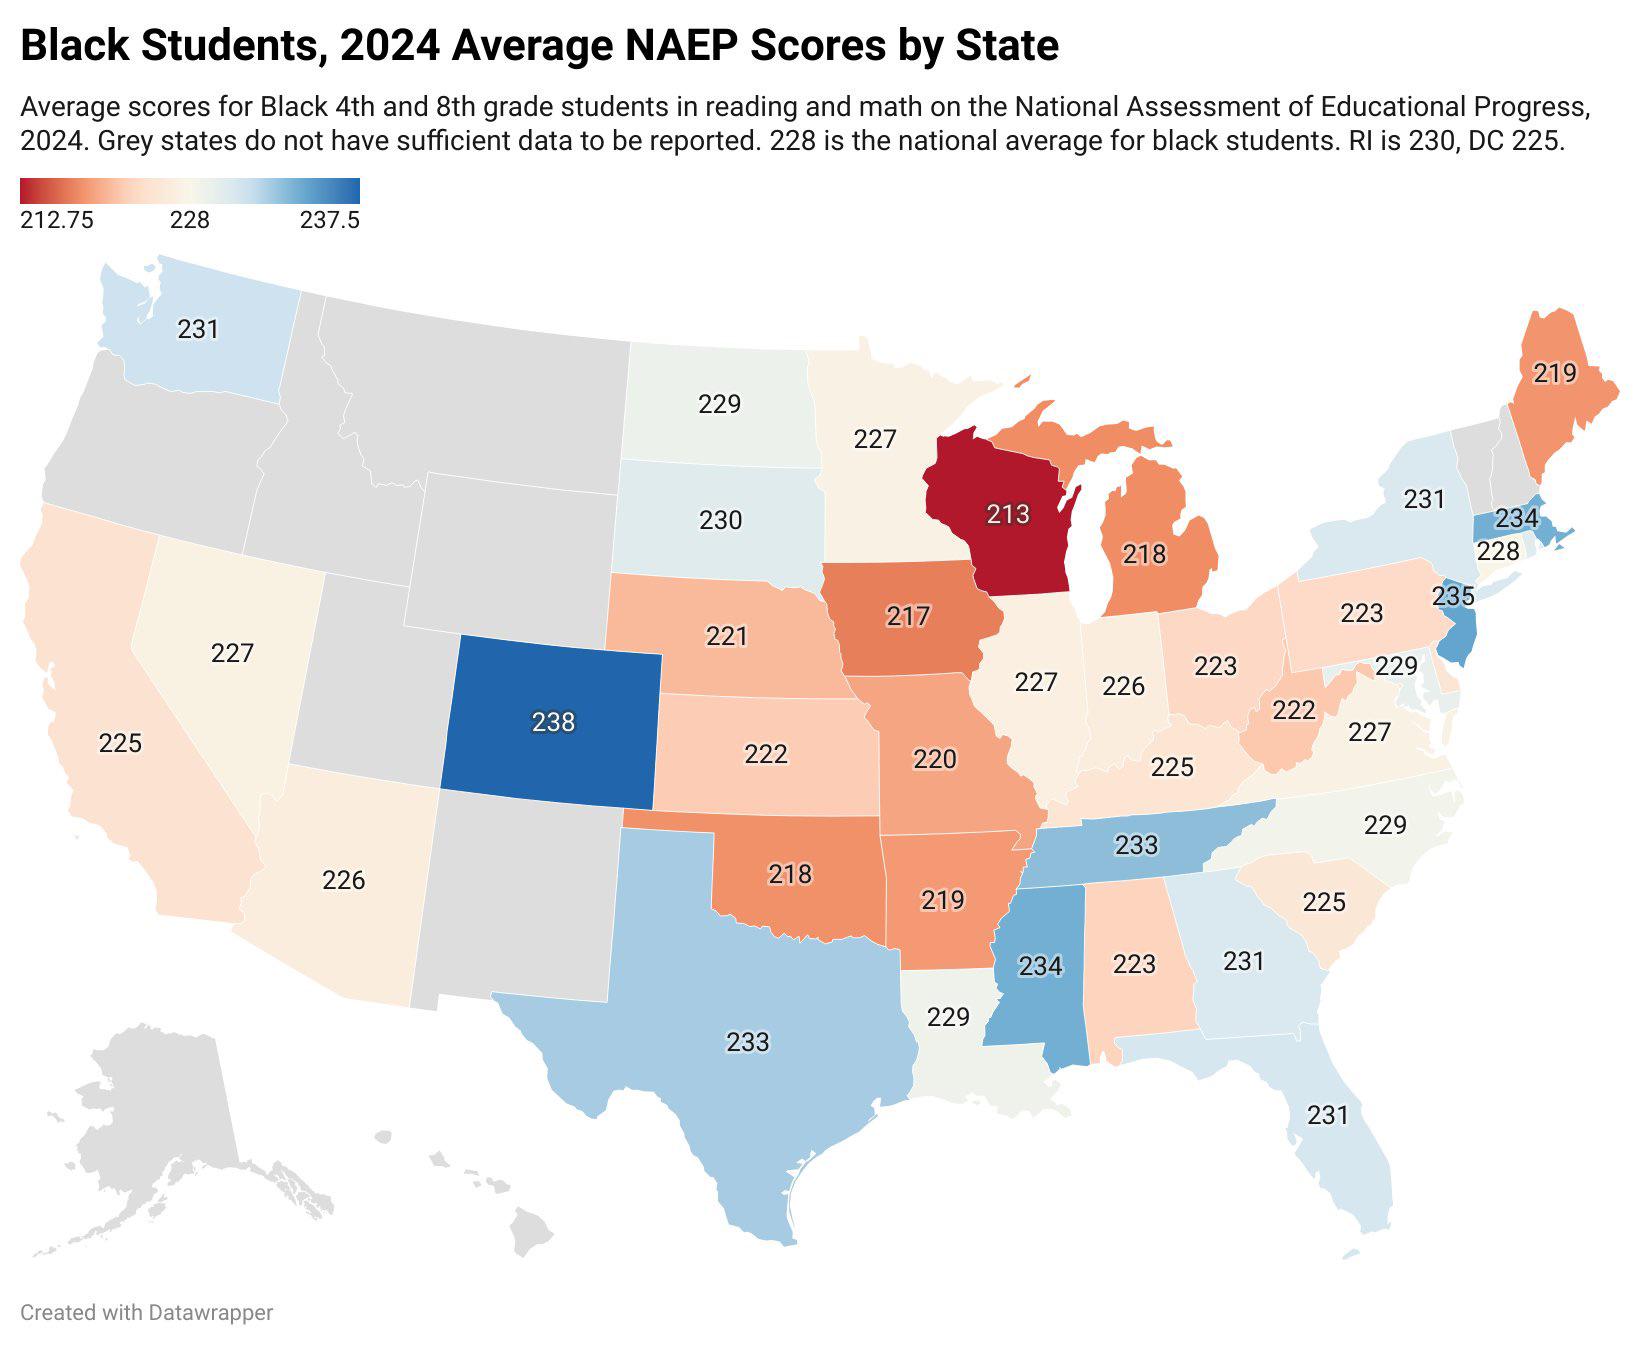
The "Black Student Test Scores by US State" map visualizes the academic performance of Black students across various states in the U.S. This representation brings to light significant disparities in educational achievement, showcasing how test scores vary from state to state. Understanding these differences is crucial for addressing educational inequities that persist in the United States today.
Deep Dive into Black Student Test Scores
When we delve into the topic of Black student test scores, we uncover a complex landscape shaped by a myriad of factors. Test scores often reflect not only individual student performance but also systemic issues within the education system, including funding disparities, access to resources, and socioeconomic factors.
Interestingly, national assessments such as the National Assessment of Educational Progress (NAEP) often reveal that Black students tend to score lower than their white counterparts in subjects like math and reading. For example, in 2019, the NAEP reported that only 18% of Black eighth graders were proficient in math, compared to 49% of white students. This gap underscores the importance of examining the broader context in which education takes place.
Moreover, factors such as school funding play a critical role. States that allocate more money per pupil tend to have better educational outcomes. Unfortunately, many predominantly Black school districts operate with significantly less funding than their counterparts in predominantly white areas. According to the Education Trust, Black students are more likely to attend schools that are underfunded and overcrowded, leading to limited access to advanced coursework, experienced teachers, and extracurricular activities that enrich the educational experience.
Socioeconomic status also significantly impacts educational achievement. Students from lower-income households may face challenges such as unstable housing, food insecurity, and lack of access to technology—all of which can hinder academic performance. Have you ever considered how these external factors shape the learning environment for students? It’s a critical aspect to understand the achievement gap.
Furthermore, cultural factors and community engagement can influence educational outcomes. Schools that prioritize culturally relevant pedagogy and foster strong relationships with families often see improved test scores among Black students. This highlights the need for educational policies that not only focus on standardized testing but also embrace holistic approaches to student success.
Regional Analysis
As we analyze the map, it becomes evident that regional differences in test scores for Black students are pronounced. For instance, states like Massachusetts and New Jersey often report higher test scores compared to states in the Deep South, such as Mississippi and Louisiana. Massachusetts, known for its robust education system, has made significant strides in addressing equity for Black students, whereas Mississippi continues to struggle with educational disparities.
Interestingly, in states like Maryland and Virginia, we see a mixed picture. While urban areas may show higher scores due to better funding and resources, rural areas can lag significantly behind, reflecting the varying educational landscapes even within the same state. This points to a critical consideration: urban-rural divides also impact educational outcomes.
Another noteworthy comparison is between states with large urban centers versus those that are more rural. Urban areas often have specialized programs aimed at improving educational outcomes for marginalized groups, yet they can also face challenges such as overcrowded classrooms and high student-to-teacher ratios. Conversely, rural schools may have smaller class sizes, but they often lack the funding and resources needed to provide a comprehensive education.
Significance and Impact
Understanding the implications of Black student test scores is paramount for shaping educational policy and practice. The disparities highlighted by the map are not just numbers; they represent real students and communities affected by systemic inequities. By addressing these gaps, educators, policymakers, and community leaders can work toward creating a more equitable education system.
Current trends indicate a growing awareness of these issues, with movements advocating for increased funding and resources for underperforming schools and programs designed to support Black students specifically. However, there is still a long way to go. Future projections suggest that without significant intervention, the achievement gap may persist, continuing to affect generations of students.
In conclusion, the "Black Student Test Scores by US State" map serves as a crucial tool for visualizing educational disparities. It challenges us to consider the factors that contribute to these differences and inspires action towards a more equitable future for all students. Have you noticed how these educational inequities can impact not just individual lives but entire communities? It’s a call to action for educators and policymakers alike to make meaningful changes that support every student’s potential to succeed.
Visualization Details
- Published
- August 20, 2025
- Views
- 74
Comments
Loading comments...