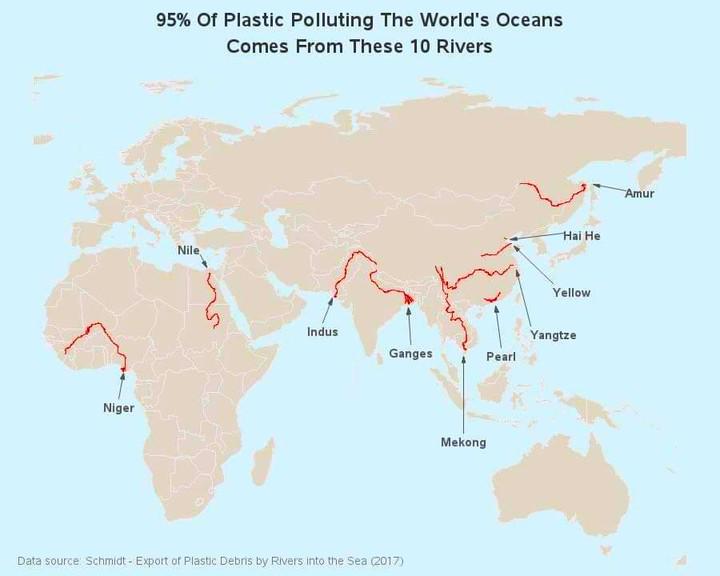
Map of Rivers Contributing to Ocean Plastic


David Chen
Data Visualization Specialist
David Chen is an expert in transforming complex geographic datasets into compelling visual narratives. He combines his background in computer science ...
Geographic Analysis
What This Map Shows
The map titled "95% of Ocean Plastic Originates from These 10 Rivers" highlights the critical role that certain river systems play in the global plastic pollution crisis. It pinpoints the top ten rivers that are responsible for the majority of plastic waste entering our oceans. This visualization serves as a wake-up call, illustrating how interconnected our waterways are with the health of marine environments. Understanding the specific rivers involved allows us to address the root causes of this pressing environmental issue.
Deep Dive into River Systems and Plastic Pollution
Rivers are vital lifelines for ecosystems, communities, and economies. However, they are also conduits for plastic waste, often carrying debris from urban areas to the sea. What's fascinating is that a mere handful of rivers contribute disproportionately to the problem. For instance, the Yangtze River in China is often cited as the largest single contributor, discharging an estimated 1.5 million metric tons of plastic into the ocean each year. Other notable rivers, such as the Ganges in India and the Niger in Africa, follow closely behind.
The reasons for such high levels of pollution in these rivers are complex. Many of these waterways flow through densely populated urban regions where waste management systems are inadequate. In cities like Dhaka and Jakarta, rapid urbanization has outpaced infrastructure development, leading to increased waste generation without proper disposal methods. Consequently, much of this waste ends up in rivers, which then transport it to the ocean.
Furthermore, the flow patterns of these rivers exacerbate the situation. Rivers with high discharge rates, like the Amazon and the Congo, can carry vast amounts of debris over long distances. Interestingly, the geography of a river—its width, depth, and flow velocity—can significantly influence how much plastic it transports. In contrast, smaller rivers with slower flow may accumulate debris in their banks, creating localized pollution hotspots.
In addition to the physical characteristics of rivers, socio-economic factors play a pivotal role. Regions with low economic development often lack the necessary resources for effective waste management. In many cases, informal dumping practices prevail, where plastics are discarded without regard for environmental consequences. As a result, these communities inadvertently contribute to global ocean plastic levels.
Regional Analysis
Examining the regions represented in this map reveals stark contrasts in how different areas manage plastic waste. In Asia, the sheer population density combined with inadequate waste infrastructure creates a perfect storm for river pollution. The Ganges, for example, not only serves as a crucial water source for millions, but it also faces overwhelming pollution challenges. The Indian government has initiated several clean-up campaigns, yet significant challenges remain.
Conversely, rivers in more developed regions tend to have better waste management systems, but they are not immune to plastic pollution. The Mississippi River in the United States, while not in the top 10, still contributes to ocean plastic due to runoff and littering in urban areas along its banks. In Europe, rivers are often cleaner due to stringent environmental regulations, but plastic pollution still exists, particularly from microplastics and upstream sources.
Interestingly, some rivers are beginning to see innovative solutions to combat plastic pollution. Initiatives like river clean-up projects and community awareness campaigns are emerging as effective strategies. For example, the partnership between local governments and NGOs in Southeast Asia aims to reduce plastic waste at the source by improving waste management practices and educating communities about the importance of keeping rivers clean.
Significance and Impact
The implications of riverine plastic pollution extend far beyond the immediate environment. Marine ecosystems suffer tremendously from plastic waste, with wildlife ingesting or becoming entangled in debris. This not only endangers marine species but also impacts human health, as microplastics enter the food chain. Ever wondered why seafood sometimes tastes off? Well, it could be linked to the plastic pollution affecting our oceans.
Moreover, the economic costs associated with cleaning up plastic waste are staggering. Coastal communities that rely on tourism and fishing are particularly affected by polluted waters, which can deter visitors and threaten livelihoods. According to a World Bank report, the global economic impact of marine plastic pollution is estimated to reach billions of dollars annually.
As we move forward, understanding the geographic origins of ocean plastic is crucial for developing targeted solutions. Investing in infrastructure, enhancing public awareness, and fostering international cooperation are all vital steps toward addressing this urgent issue. If we want to reduce the flow of plastic into our oceans, we must focus on these critical rivers and the communities that surround them.
By recognizing the geographical patterns of plastic pollution, we can devise effective strategies to protect our rivers and, ultimately, our oceans. The fight against plastic pollution is not just about cleaning up our beaches; it's about tackling the problem at its source and making informed changes that benefit both the environment and society as a whole.
Visualization Details
- Published
- August 11, 2025
- Views
- 116
Comments
Loading comments...