US States Peak House Seats Decade Map


Marcus Rodriguez
Historical Geography Expert
Marcus Rodriguez specializes in historical cartography and geographic data analysis. With a background in both history and geography, he brings unique...
Geographic Analysis
What This Map Shows
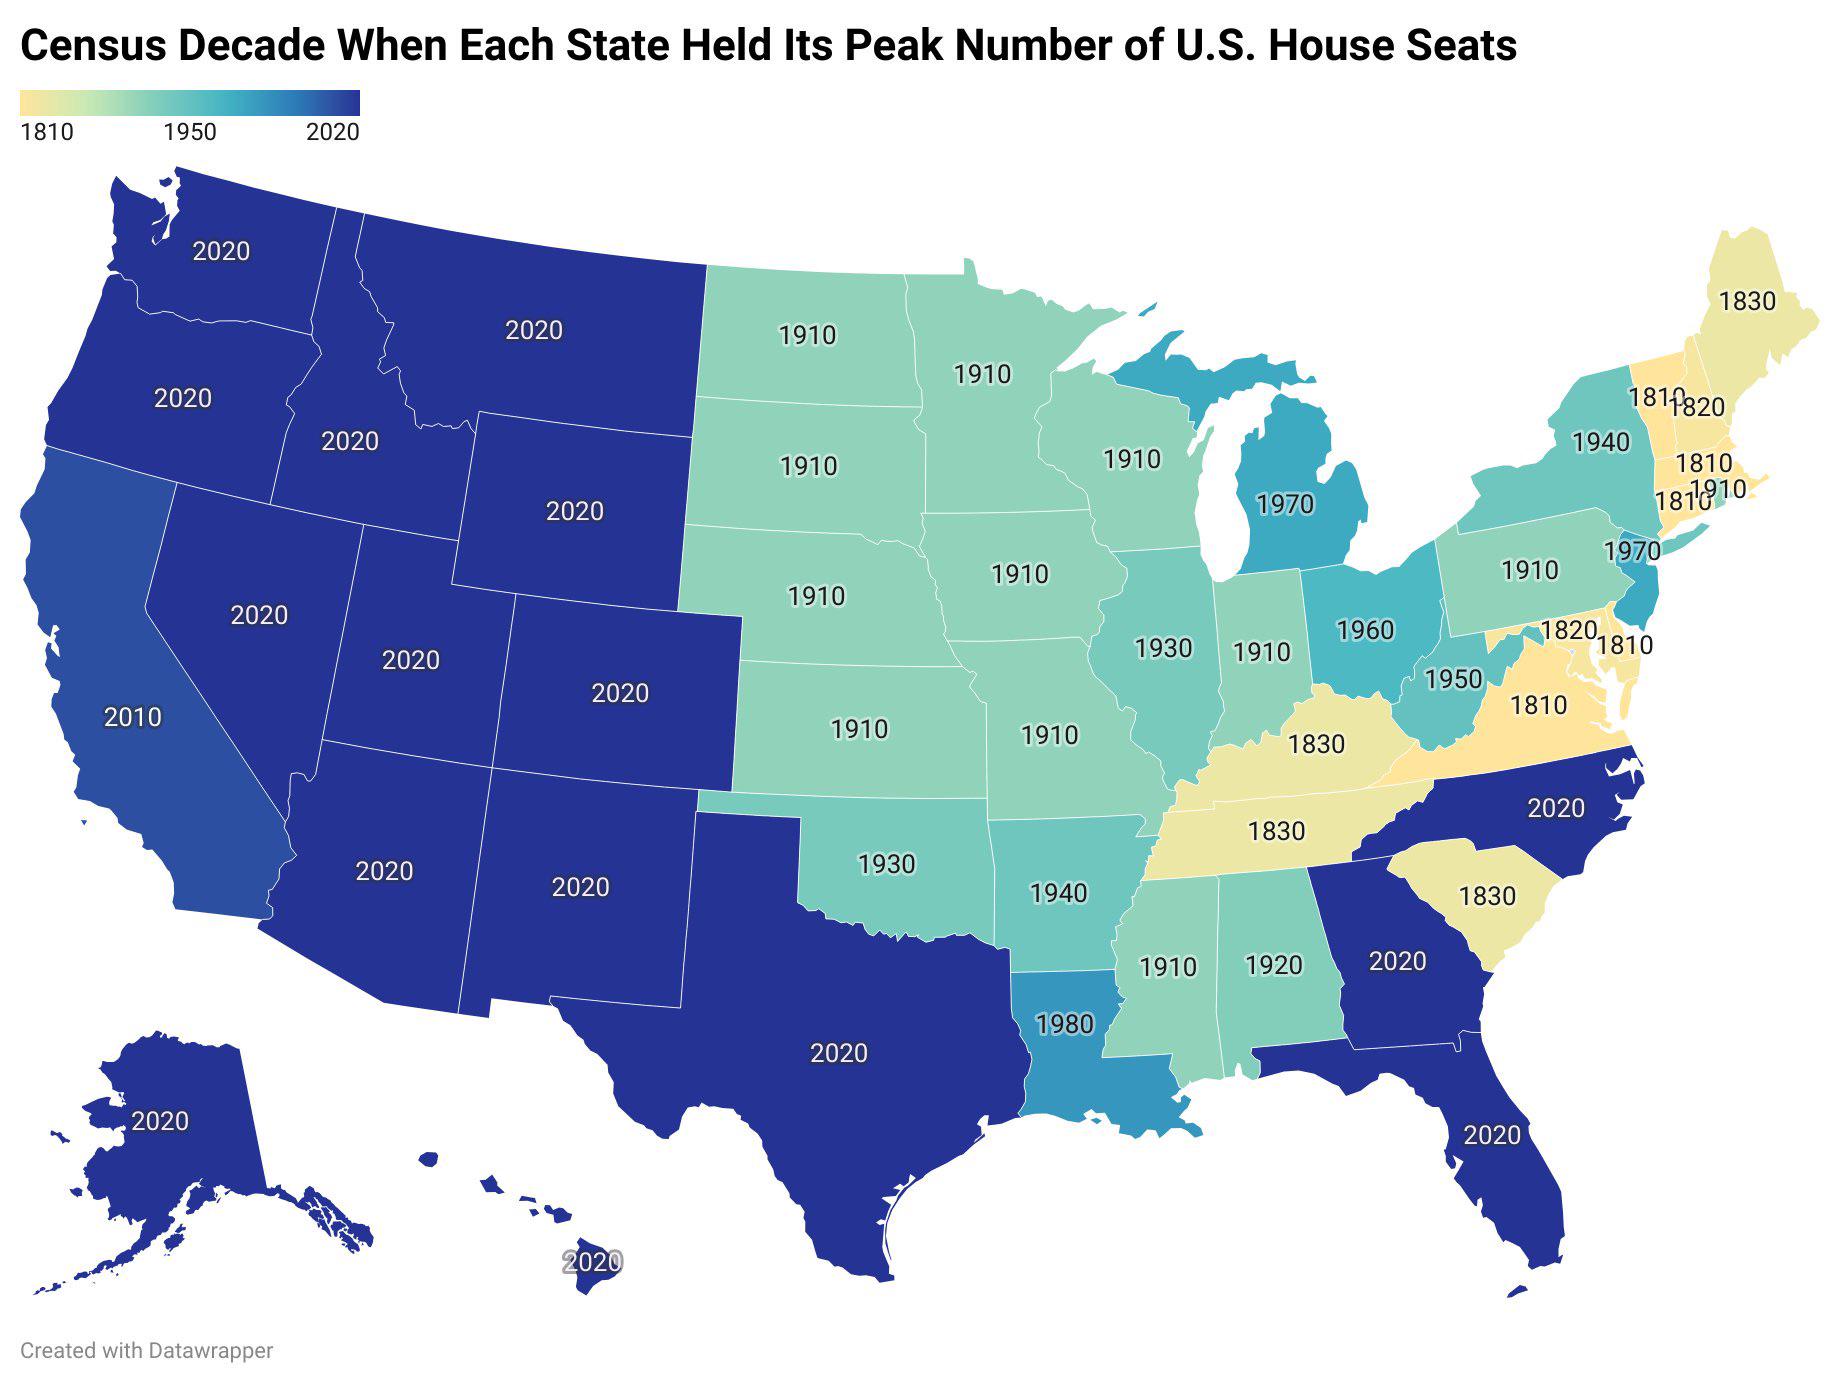
This map visually represents the decade in which each U.S. state reached its maximum number of congressional House seats. Congressional representation is determined by the decennial U.S. Census, which counts the population and allocates House seats accordingly. This visualization highlights the fluctuations in representation over time, illustrating how population growth, migration trends, and demographic shifts have influenced the political landscape of the United States.
Deep Dive into Congressional Representation
The U.S. House of Representatives is a critical component of American democracy, with its number of seats directly linked to the population of each state. Initially, the House was established with 65 members, but as the nation grew, so did its representation. The most recent Census in 2020 revealed significant shifts, with states like Texas gaining seats and states like California experiencing a decline for the first time in history.
Interestingly, the growth of House seats in individual states often reflects larger national trends in migration and urbanization. For instance, the South and West have seen substantial population increases over the past several decades, leading to a rise in House seats for states such as Florida and Arizona. On the other hand, states in the Northeast and Midwest, like New York and Illinois, have seen population stagnation or decline, resulting in a loss of representation.
The peak decades for House seats vary widely among states. For example, states such as Texas peaked in the 2010s, reflecting its rapid population growth, while states like West Virginia peaked in the 1930s as industrialization attracted many workers. The reasons for these peaks are multifaceted and include economic opportunities, natural resources, and even climate factors.
The 1960s and 1970s were significant decades for many states, coinciding with the post-World War II economic boom and the civil rights movement, which prompted migration patterns as people sought better opportunities and living conditions. This period witnessed significant growth in urban areas, further concentrating populations in specific regions, which directly influenced the number of House seats assigned.
Regional Analysis
Examining the map, we can see distinct patterns emerge across different regions. The Northeast has historically had high representation, peaking in the mid-20th century; however, many states are now seeing declines. For instance, New York peaked in the 1930s, and despite its massive population, it has lost House seats in recent decades, highlighting a trend of out-migration.
In contrast, the South is thriving. States like Texas and Florida have seen peaks in the last two decades, driven by a combination of economic opportunities and more favorable climates. Texas, in particular, has gained a reputation as a booming hub for technology and business, which has attracted a diverse population.
Interestingly, the Midwest has shown mixed results. States like Ohio peaked in the 1930s, while states like Indiana and Wisconsin have managed to maintain their representation, albeit with slight fluctuations. The agricultural economy and stable job market have helped Indiana maintain a consistent population, resulting in steadier House representation compared to its neighboring states.
Significance and Impact
Understanding the peaks in congressional representation is crucial for several reasons. First, it highlights the changing dynamics of American demographics and migration patterns. As populations shift, so do the power dynamics in Congress, which can influence national policies on immigration, healthcare, and education.
Moreover, these changes can affect resource allocation. States that gain seats often see a boost in federal funding for infrastructure, education, and social services, while those losing seats may find themselves on the losing end of budget decisions.
Looking forward, these trends suggest that the Southern and Western states will continue to grow in representation, while some Northern states may face further declines. The implications of this are profound, affecting everything from local economies to national political strategies. As we approach the next Census in 2030, it will be interesting to see how these trends evolve and what new patterns emerge in the representation of House seats across the United States.
Visualization Details
- Published
- August 8, 2025
- Views
- 208
Comments
Loading comments...