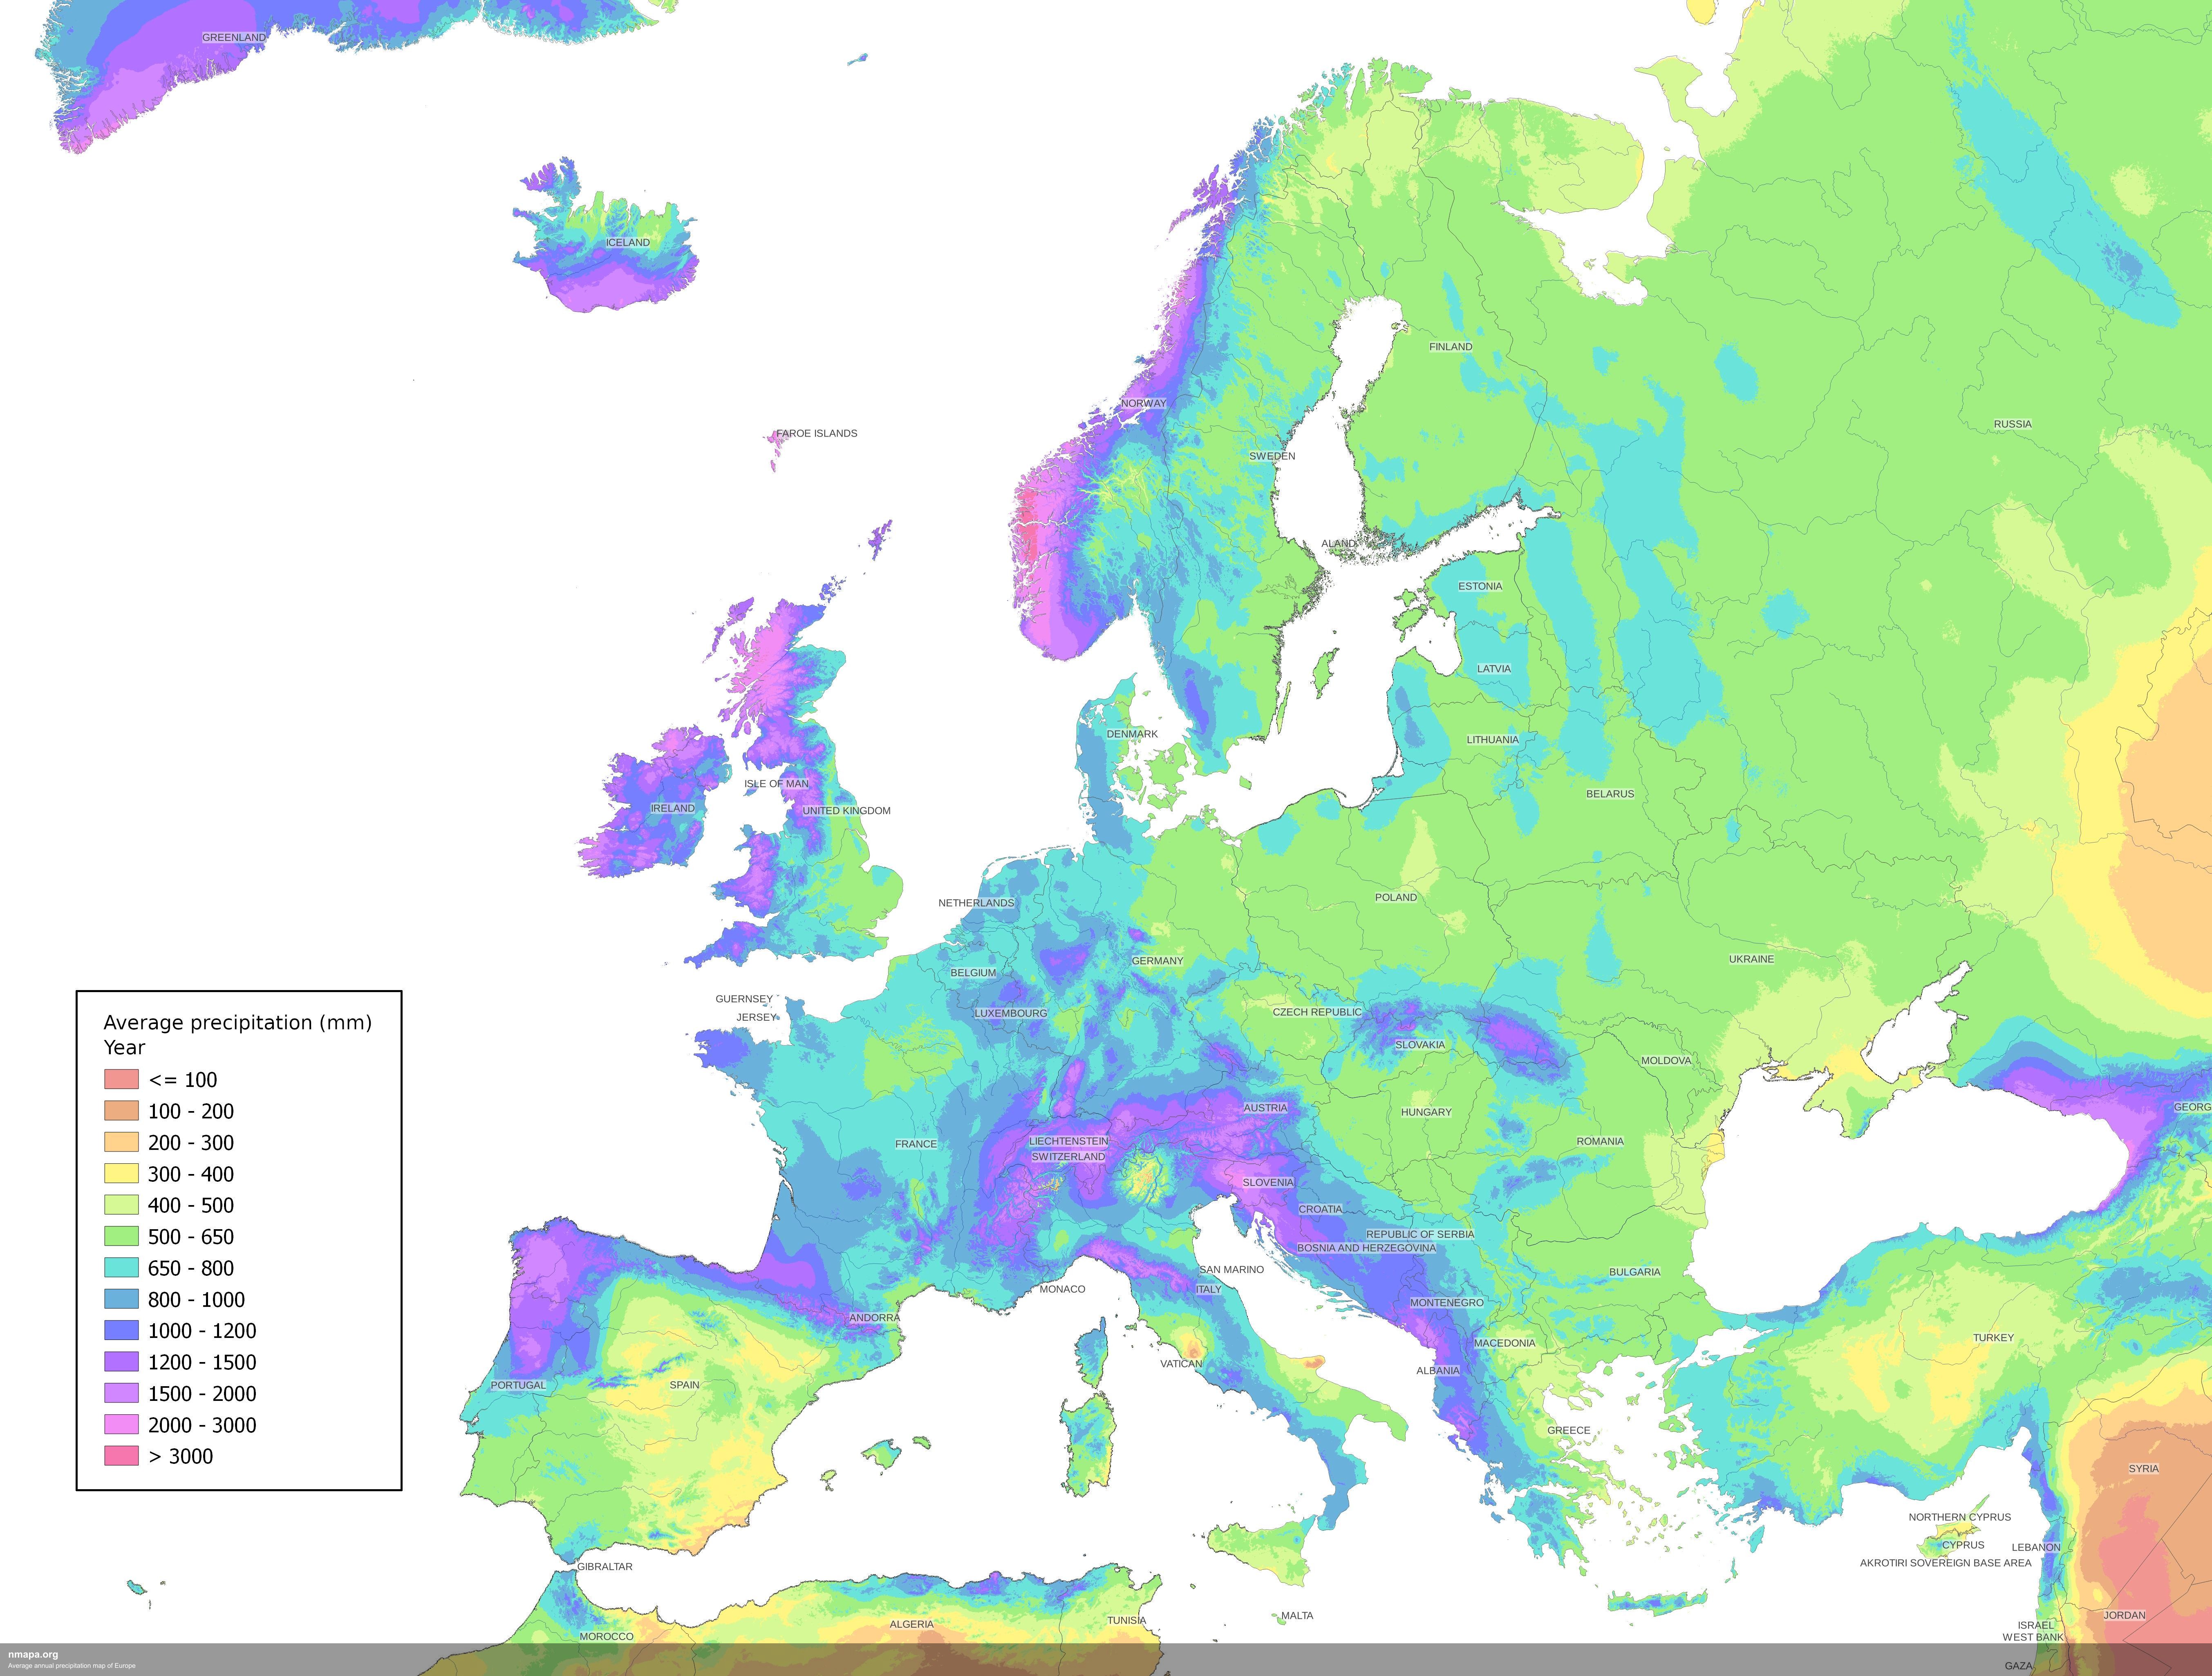
Average Annual Precipitation Map of Europe


David Chen
Data Visualization Specialist
David Chen is an expert in transforming complex geographic datasets into compelling visual narratives. He combines his background in computer science ...
Geographic Analysis
The Average Annual Precipitation Map of Europe offers a detailed visualization of rainfall patterns across the continent. This map highlights regions based on their average annual precipitation, providing valuable insights into the climatic conditions of various countries. By illustrating the varying amounts of rainfall, the map enables viewers to identify wet and dry areas in Europe, which can influence agriculture, water resources, and ecosystem diversity.
Geographically, this map is significant as it underscores the diverse climatic zones present in Europe. For instance, while Norway is often recognized as the rainiest country in Europe, the map reveals that the village of Crkvice in Montenegro, located near the Adriatic Sea, holds the title of the wettest inhabited place on the continent. This highlights the importance of microclimates and localized weather patterns that can lead to significant variations in precipitation within relatively short distances.
Conversely, the Average Annual Precipitation Map of Europe also identifies some of the driest regions. The Gargano Peninsula in Italy, situated across the Adriatic Sea from Crkvice, showcases markedly lower precipitation levels, making it one of Europe’s driest areas. Other regions such as the Alicante area in Spain and the Danube Delta, which spans Romania and Ukraine, further exemplify the geographical diversity of precipitation across Europe. These contrasts provide important context for understanding regional climates and their implications for human activities.
Historically and culturally, precipitation patterns have played a crucial role in shaping the livelihoods of communities across Europe. Regions with higher rainfall, such as parts of the United Kingdom and Norway, benefit from lush landscapes that support agriculture and forestry. In contrast, drier areas like the Gargano Peninsula have adapted their agricultural practices to cope with limited water resources. The map serves as an educational tool for understanding how these climatic conditions influence settlement patterns, economic activities, and cultural practices across Europe.
By examining the Average Annual Precipitation Map of Europe, viewers can gain insights into broader geographical concepts such as climate classification, water resource management, and environmental sustainability. The visualization aids in understanding the interconnectedness of climate and human activities, illustrating how precipitation impacts everything from farming practices to urban planning.
In summary, the Average Annual Precipitation Map of Europe is not only a valuable resource for geographers and climatologists but also serves a broader audience interested in understanding the climatic dynamics of the continent. It highlights important regional patterns, supports educational initiatives, and fosters a deeper appreciation for the geographical diversity of Europe, demonstrating how rainfall shapes both natural ecosystems and human societies.
Visualization Details
- Published
- August 2, 2025
- Views
- 170
Comments
Loading comments...